|
Download Data (XLS File) |
|
|||||
|
|||||
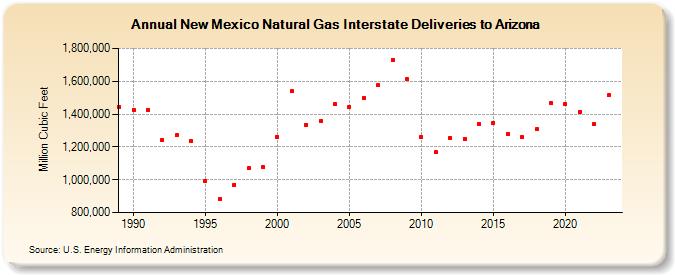
| New Mexico Natural Gas Interstate Deliveries to Arizona (Million Cubic Feet) | |||||
| Decade | Year-0 | Year-1 | Year-2 | Year-3 | Year-4 | Year-5 | Year-6 | Year-7 | Year-8 | Year-9 |
|---|---|---|---|---|---|---|---|---|---|---|
| 1980's | 1,441,748 | |||||||||
| 1990's | 1,426,995 | 1,427,729 | 1,244,223 | 1,270,649 | 1,234,695 | 994,103 | 883,918 | 969,669 | 1,069,361 | 1,076,545 |
| 2000's | 1,262,272 | 1,539,775 | 1,335,254 | 1,360,744 | 1,460,182 | 1,444,317 | 1,496,283 | 1,574,306 | 1,729,342 | 1,612,002 |
| 2010's | 1,260,223 | 1,167,295 | 1,256,916 | 1,248,425 | 1,337,947 | 1,345,871 | 1,277,824 | 1,258,174 | 1,305,997 | 1,466,726 |
| 2020's | 1,460,511 | 1,414,528 | 1,337,943 |
| - = No Data Reported; -- = Not Applicable; NA = Not Available; W = Withheld to avoid disclosure of individual company data. |
| Release Date: 4/30/2024 |
| Next Release Date: 5/31/2024 |