|
Download Data (XLS File) |
|
|||||
|
|||||
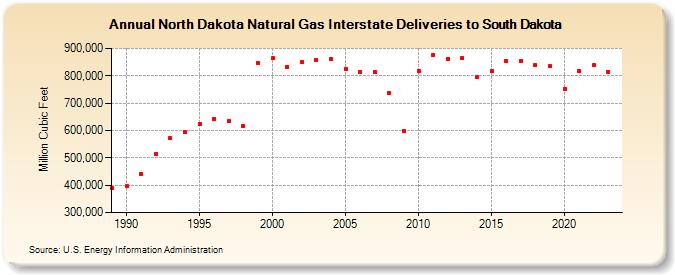
| North Dakota Natural Gas Interstate Deliveries to South Dakota (Million Cubic Feet) | |||||
| Decade | Year-0 | Year-1 | Year-2 | Year-3 | Year-4 | Year-5 | Year-6 | Year-7 | Year-8 | Year-9 |
|---|---|---|---|---|---|---|---|---|---|---|
| 1980's | 388,332 | |||||||||
| 1990's | 396,842 | 440,399 | 514,901 | 571,848 | 594,199 | 624,457 | 643,401 | 633,621 | 616,740 | 845,062 |
| 2000's | 863,706 | 830,273 | 850,671 | 859,065 | 861,235 | 824,743 | 812,511 | 813,970 | 736,739 | 599,652 |
| 2010's | 818,970 | 876,021 | 860,995 | 865,582 | 793,807 | 816,831 | 854,237 | 854,705 | 839,000 | 834,237 |
| 2020's | 752,698 | 818,965 | 837,936 |
| - = No Data Reported; -- = Not Applicable; NA = Not Available; W = Withheld to avoid disclosure of individual company data. |
| Release Date: 4/30/2024 |
| Next Release Date: 5/31/2024 |