|
Download Data (XLS File) |
|
|||||
|
|||||
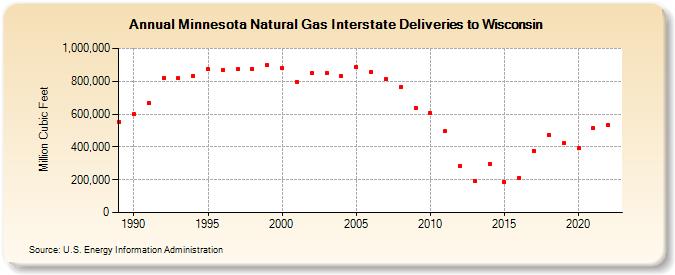
| Minnesota Natural Gas Interstate Deliveries to Wisconsin (Million Cubic Feet) | |||||
| Decade | Year-0 | Year-1 | Year-2 | Year-3 | Year-4 | Year-5 | Year-6 | Year-7 | Year-8 | Year-9 |
|---|---|---|---|---|---|---|---|---|---|---|
| 1980's | 553,205 | |||||||||
| 1990's | 597,650 | 667,113 | 818,678 | 817,672 | 833,235 | 872,950 | 871,327 | 872,001 | 876,281 | 897,329 |
| 2000's | 879,724 | 795,903 | 847,779 | 849,396 | 829,650 | 886,611 | 858,495 | 813,376 | 766,252 | 636,952 |
| 2010's | 606,285 | 494,246 | 284,543 | 193,966 | 297,787 | 187,549 | 212,233 | 376,662 | 475,244 | 421,669 |
| 2020's | 391,937 | 513,837 | 535,050 |
| - = No Data Reported; -- = Not Applicable; NA = Not Available; W = Withheld to avoid disclosure of individual company data. |
| Release Date: 4/30/2024 |
| Next Release Date: 5/31/2024 |