|
Download Data (XLS File) |
|
|||||
|
|||||
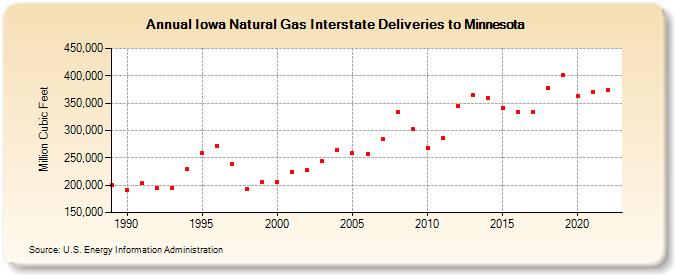
| Iowa Natural Gas Interstate Deliveries to Minnesota (Million Cubic Feet) | |||||
| Decade | Year-0 | Year-1 | Year-2 | Year-3 | Year-4 | Year-5 | Year-6 | Year-7 | Year-8 | Year-9 |
|---|---|---|---|---|---|---|---|---|---|---|
| 1980's | 200,281 | |||||||||
| 1990's | 191,419 | 203,239 | 195,239 | 195,371 | 229,561 | 258,621 | 271,648 | 237,858 | 192,518 | 204,975 |
| 2000's | 206,715 | 223,986 | 228,433 | 243,418 | 264,064 | 258,737 | 257,528 | 284,002 | 333,798 | 302,336 |
| 2010's | 267,920 | 286,747 | 345,067 | 364,937 | 359,602 | 341,589 | 334,132 | 334,120 | 377,747 | 401,820 |
| 2020's | 363,584 | 370,690 | 374,338 |
| - = No Data Reported; -- = Not Applicable; NA = Not Available; W = Withheld to avoid disclosure of individual company data. |
| Release Date: 4/30/2024 |
| Next Release Date: 5/31/2024 |
Referring Pages: