|
Download Data (XLS File) |
|
|||||
|
|||||
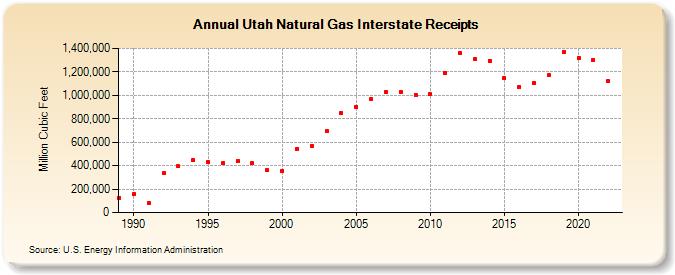
| Utah Natural Gas Interstate Receipts (Million Cubic Feet) | |||||
| Decade | Year-0 | Year-1 | Year-2 | Year-3 | Year-4 | Year-5 | Year-6 | Year-7 | Year-8 | Year-9 |
|---|---|---|---|---|---|---|---|---|---|---|
| 1980's | 126,786 | |||||||||
| 1990's | 156,942 | 85,735 | 333,653 | 393,269 | 444,646 | 431,245 | 420,103 | 443,318 | 420,012 | 359,246 |
| 2000's | 356,690 | 543,761 | 570,772 | 691,823 | 848,851 | 902,767 | 971,875 | 1,031,818 | 1,029,571 | 1,004,646 |
| 2010's | 1,007,828 | 1,190,204 | 1,363,645 | 1,309,723 | 1,293,589 | 1,147,379 | 1,072,291 | 1,105,681 | 1,172,486 | 1,370,539 |
| 2020's | 1,318,176 | 1,299,420 | 1,121,585 |
| - = No Data Reported; -- = Not Applicable; NA = Not Available; W = Withheld to avoid disclosure of individual company data. |
| Release Date: 8/30/2024 |
| Next Release Date: 9/30/2024 |