|
Download Data (XLS File) |
|
|||||
|
|||||
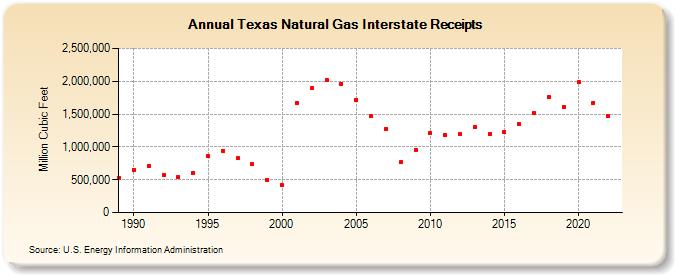
| Texas Natural Gas Interstate Receipts (Million Cubic Feet) | |||||
| Decade | Year-0 | Year-1 | Year-2 | Year-3 | Year-4 | Year-5 | Year-6 | Year-7 | Year-8 | Year-9 |
|---|---|---|---|---|---|---|---|---|---|---|
| 1980's | 531,621 | |||||||||
| 1990's | 653,332 | 709,907 | 566,789 | 538,183 | 603,826 | 853,812 | 941,088 | 824,731 | 734,541 | 497,937 |
| 2000's | 417,392 | 1,671,259 | 1,892,828 | 2,018,089 | 1,962,214 | 1,716,017 | 1,463,806 | 1,276,734 | 769,176 | 952,704 |
| 2010's | 1,211,692 | 1,187,815 | 1,192,122 | 1,299,534 | 1,197,350 | 1,232,960 | 1,347,906 | 1,512,820 | 1,752,469 | 1,612,665 |
| 2020's | 1,981,437 | 1,672,642 | 1,463,209 |
| - = No Data Reported; -- = Not Applicable; NA = Not Available; W = Withheld to avoid disclosure of individual company data. |
| Release Date: 3/29/2024 |
| Next Release Date: 4/30/2024 |