|
Download Data (XLS File) |
|
|||||
|
|||||
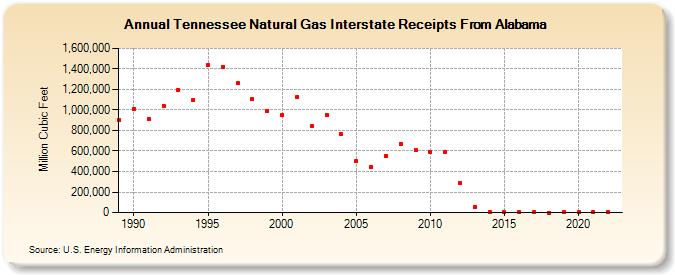
| Tennessee Natural Gas Interstate Receipts From Alabama (Million Cubic Feet) | |||||
| Decade | Year-0 | Year-1 | Year-2 | Year-3 | Year-4 | Year-5 | Year-6 | Year-7 | Year-8 | Year-9 |
|---|---|---|---|---|---|---|---|---|---|---|
| 1980's | 903,907 | |||||||||
| 1990's | 1,008,250 | 914,423 | 1,042,556 | 1,195,081 | 1,096,867 | 1,441,782 | 1,423,143 | 1,261,194 | 1,103,063 | 992,686 |
| 2000's | 950,364 | 1,127,802 | 840,588 | 951,228 | 764,749 | 498,942 | 444,726 | 549,713 | 671,847 | 609,136 |
| 2010's | 594,971 | 592,877 | 286,769 | 52,561 | 2,404 | 2,632 | 3,501 | 3,915 | 476 | 693 |
| 2020's | 884 | 774 | 807 |
| - = No Data Reported; -- = Not Applicable; NA = Not Available; W = Withheld to avoid disclosure of individual company data. |
| Release Date: 4/30/2024 |
| Next Release Date: 5/31/2024 |