|
Download Data (XLS File) |
|
|||||
|
|||||
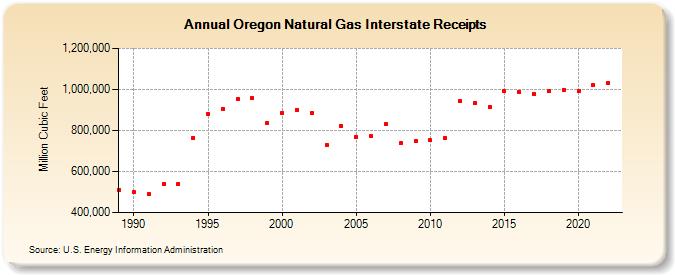
| Oregon Natural Gas Interstate Receipts (Million Cubic Feet) | |||||
| Decade | Year-0 | Year-1 | Year-2 | Year-3 | Year-4 | Year-5 | Year-6 | Year-7 | Year-8 | Year-9 |
|---|---|---|---|---|---|---|---|---|---|---|
| 1980's | 510,333 | |||||||||
| 1990's | 500,269 | 488,666 | 541,201 | 540,702 | 765,764 | 882,385 | 906,506 | 954,325 | 957,810 | 838,607 |
| 2000's | 887,461 | 901,982 | 885,998 | 729,747 | 822,681 | 767,942 | 774,178 | 830,689 | 736,644 | 749,806 |
| 2010's | 751,355 | 763,339 | 942,950 | 933,264 | 915,509 | 990,297 | 988,785 | 979,672 | 990,672 | 998,536 |
| 2020's | 992,213 | 1,019,697 | 1,030,184 |
| - = No Data Reported; -- = Not Applicable; NA = Not Available; W = Withheld to avoid disclosure of individual company data. |
| Release Date: 3/29/2024 |
| Next Release Date: 4/30/2024 |