|
Download Data (XLS File) |
|
|||||
|
|||||
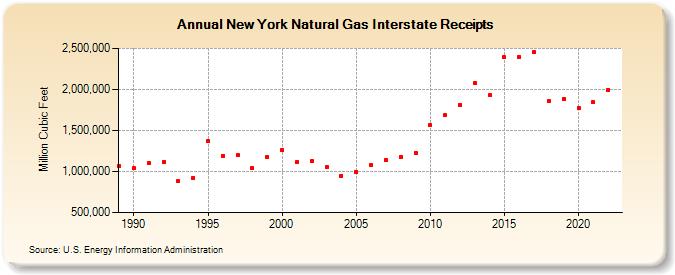
| New York Natural Gas Interstate Receipts (Million Cubic Feet) | |||||
| Decade | Year-0 | Year-1 | Year-2 | Year-3 | Year-4 | Year-5 | Year-6 | Year-7 | Year-8 | Year-9 |
|---|---|---|---|---|---|---|---|---|---|---|
| 1980's | 1,066,665 | |||||||||
| 1990's | 1,039,598 | 1,105,278 | 1,121,178 | 881,247 | 926,727 | 1,376,638 | 1,194,754 | 1,196,768 | 1,042,286 | 1,173,917 |
| 2000's | 1,262,403 | 1,115,154 | 1,122,596 | 1,056,266 | 949,081 | 995,730 | 1,077,163 | 1,142,965 | 1,179,378 | 1,230,058 |
| 2010's | 1,569,348 | 1,683,412 | 1,815,699 | 2,079,904 | 1,929,355 | 2,389,416 | 2,396,260 | 2,456,908 | 1,853,038 | 1,885,060 |
| 2020's | 1,776,623 | 1,843,181 | 1,993,234 |
| - = No Data Reported; -- = Not Applicable; NA = Not Available; W = Withheld to avoid disclosure of individual company data. |
| Release Date: 3/29/2024 |
| Next Release Date: 4/30/2024 |