|
Download Data (XLS File) |
|
|||||
|
|||||
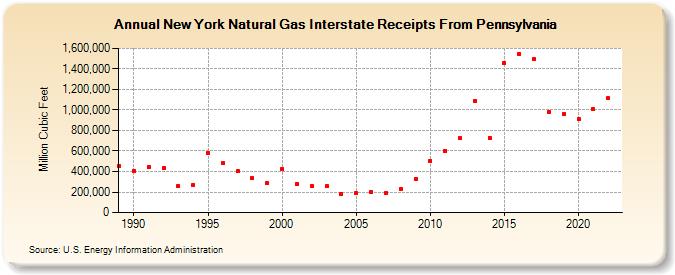
| New York Natural Gas Interstate Receipts From Pennsylvania (Million Cubic Feet) | |||||
| Decade | Year-0 | Year-1 | Year-2 | Year-3 | Year-4 | Year-5 | Year-6 | Year-7 | Year-8 | Year-9 |
|---|---|---|---|---|---|---|---|---|---|---|
| 1980's | 451,571 | |||||||||
| 1990's | 408,128 | 442,902 | 435,235 | 256,422 | 270,448 | 582,940 | 484,157 | 402,443 | 333,540 | 284,017 |
| 2000's | 425,974 | 280,184 | 259,670 | 254,432 | 182,847 | 186,885 | 199,308 | 192,551 | 225,732 | 327,781 |
| 2010's | 505,444 | 604,763 | 722,194 | 1,090,767 | 729,368 | 1,457,060 | 1,549,476 | 1,494,394 | 982,711 | 959,515 |
| 2020's | 909,458 | 1,005,753 | 1,113,137 |
| - = No Data Reported; -- = Not Applicable; NA = Not Available; W = Withheld to avoid disclosure of individual company data. |
| Release Date: 3/29/2024 |
| Next Release Date: 4/30/2024 |