|
Download Data (XLS File) |
|
|||||
|
|||||
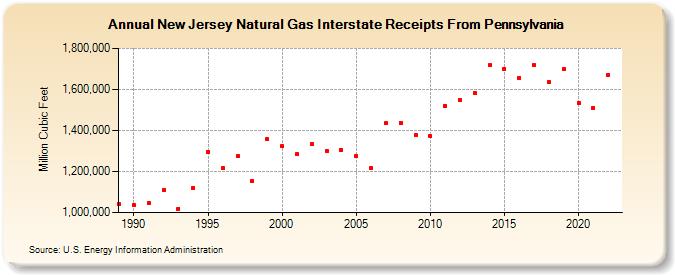
| New Jersey Natural Gas Interstate Receipts From Pennsylvania (Million Cubic Feet) | |||||
| Decade | Year-0 | Year-1 | Year-2 | Year-3 | Year-4 | Year-5 | Year-6 | Year-7 | Year-8 | Year-9 |
|---|---|---|---|---|---|---|---|---|---|---|
| 1980's | 1,039,445 | |||||||||
| 1990's | 1,036,775 | 1,048,965 | 1,108,744 | 1,018,940 | 1,119,685 | 1,296,439 | 1,217,085 | 1,274,307 | 1,154,761 | 1,357,384 |
| 2000's | 1,322,670 | 1,283,693 | 1,332,510 | 1,300,566 | 1,305,228 | 1,274,343 | 1,215,715 | 1,434,628 | 1,438,572 | 1,376,221 |
| 2010's | 1,373,802 | 1,520,670 | 1,550,686 | 1,583,481 | 1,718,767 | 1,701,775 | 1,657,915 | 1,718,923 | 1,634,610 | 1,699,035 |
| 2020's | 1,535,454 | 1,509,906 | 1,671,473 |
| - = No Data Reported; -- = Not Applicable; NA = Not Available; W = Withheld to avoid disclosure of individual company data. |
| Release Date: 4/30/2024 |
| Next Release Date: 5/31/2024 |