|
Download Data (XLS File) |
|
|||||
|
|||||
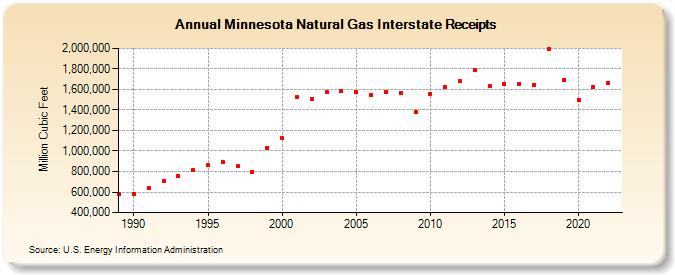
| Minnesota Natural Gas Interstate Receipts (Million Cubic Feet) | |||||
| Decade | Year-0 | Year-1 | Year-2 | Year-3 | Year-4 | Year-5 | Year-6 | Year-7 | Year-8 | Year-9 |
|---|---|---|---|---|---|---|---|---|---|---|
| 1980's | 581,545 | |||||||||
| 1990's | 584,815 | 638,534 | 706,629 | 756,282 | 814,096 | 863,304 | 892,727 | 849,959 | 791,117 | 1,032,755 |
| 2000's | 1,125,830 | 1,526,651 | 1,505,660 | 1,570,180 | 1,582,168 | 1,574,545 | 1,547,766 | 1,573,108 | 1,566,056 | 1,381,445 |
| 2010's | 1,558,527 | 1,624,608 | 1,682,986 | 1,789,520 | 1,634,889 | 1,650,904 | 1,656,703 | 1,643,809 | 1,995,688 | 1,692,747 |
| 2020's | 1,494,672 | 1,623,444 | 1,666,991 | 1,628,282 | 1,661,837 |
| - = No Data Reported; -- = Not Applicable; NA = Not Available; W = Withheld to avoid disclosure of individual company data. |
| Release Date: 5/29/2026 |
| Next Release Date: 6/30/2026 |