|
Download Data (XLS File) |
|
|||||
|
|||||
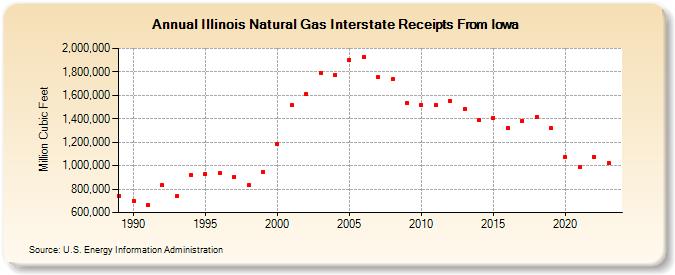
| Illinois Natural Gas Interstate Receipts From Iowa (Million Cubic Feet) | |||||
| Decade | Year-0 | Year-1 | Year-2 | Year-3 | Year-4 | Year-5 | Year-6 | Year-7 | Year-8 | Year-9 |
|---|---|---|---|---|---|---|---|---|---|---|
| 1980's | 745,211 | |||||||||
| 1990's | 702,164 | 662,612 | 831,679 | 738,025 | 924,319 | 929,427 | 933,856 | 906,321 | 832,177 | 946,331 |
| 2000's | 1,187,490 | 1,513,657 | 1,612,428 | 1,788,611 | 1,776,073 | 1,903,915 | 1,929,985 | 1,752,924 | 1,738,096 | 1,535,050 |
| 2010's | 1,519,524 | 1,515,239 | 1,551,735 | 1,480,844 | 1,385,357 | 1,406,506 | 1,321,115 | 1,384,566 | 1,416,919 | 1,319,119 |
| 2020's | 1,072,919 | 987,120 | 1,074,907 |
| - = No Data Reported; -- = Not Applicable; NA = Not Available; W = Withheld to avoid disclosure of individual company data. |
| Release Date: 3/29/2024 |
| Next Release Date: 4/30/2024 |