|
Download Data (XLS File) |
|
|||||
|
|||||
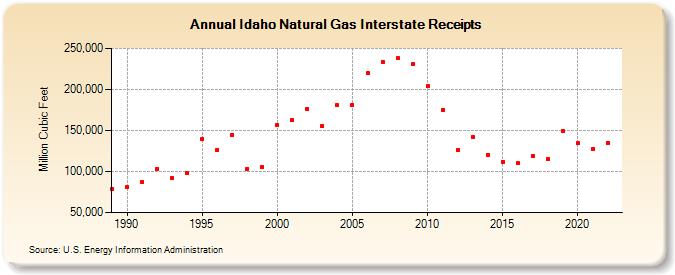
| Idaho Natural Gas Interstate Receipts (Million Cubic Feet) | |||||
| Decade | Year-0 | Year-1 | Year-2 | Year-3 | Year-4 | Year-5 | Year-6 | Year-7 | Year-8 | Year-9 |
|---|---|---|---|---|---|---|---|---|---|---|
| 1980's | 78,911 | |||||||||
| 1990's | 80,926 | 87,575 | 103,589 | 91,967 | 98,230 | 139,483 | 126,244 | 145,009 | 103,464 | 105,368 |
| 2000's | 156,481 | 162,734 | 176,374 | 155,200 | 180,519 | 181,256 | 219,714 | 233,472 | 237,853 | 230,465 |
| 2010's | 204,376 | 175,105 | 126,286 | 142,159 | 120,545 | 112,203 | 110,165 | 119,368 | 114,970 | 149,342 |
| 2020's | 134,255 | 126,918 | 135,346 |
| - = No Data Reported; -- = Not Applicable; NA = Not Available; W = Withheld to avoid disclosure of individual company data. |
| Release Date: 3/29/2024 |
| Next Release Date: 4/30/2024 |