|
Download Data (XLS File) |
|
|||||
|
|||||
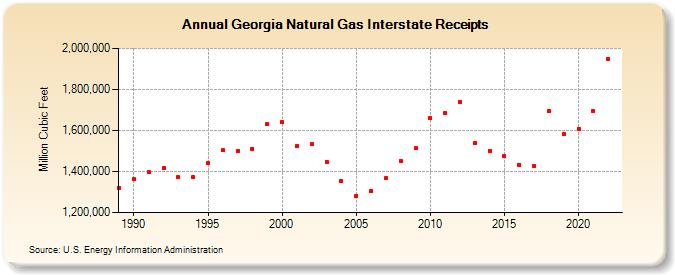
| Georgia Natural Gas Interstate Receipts (Million Cubic Feet) | |||||
| Decade | Year-0 | Year-1 | Year-2 | Year-3 | Year-4 | Year-5 | Year-6 | Year-7 | Year-8 | Year-9 |
|---|---|---|---|---|---|---|---|---|---|---|
| 1980's | 1,320,609 | |||||||||
| 1990's | 1,361,415 | 1,397,050 | 1,418,312 | 1,371,442 | 1,371,651 | 1,439,907 | 1,502,968 | 1,498,880 | 1,511,671 | 1,631,329 |
| 2000's | 1,640,769 | 1,523,898 | 1,532,177 | 1,447,164 | 1,353,193 | 1,282,549 | 1,304,376 | 1,366,016 | 1,452,988 | 1,512,570 |
| 2010's | 1,660,068 | 1,684,665 | 1,739,553 | 1,539,033 | 1,501,537 | 1,475,530 | 1,432,121 | 1,427,415 | 1,696,521 | 1,581,944 |
| 2020's | 1,609,025 | 1,693,554 | 1,950,518 |
| - = No Data Reported; -- = Not Applicable; NA = Not Available; W = Withheld to avoid disclosure of individual company data. |
| Release Date: 3/29/2024 |
| Next Release Date: 4/30/2024 |