|
Download Data (XLS File) |
|
|||||
|
|||||
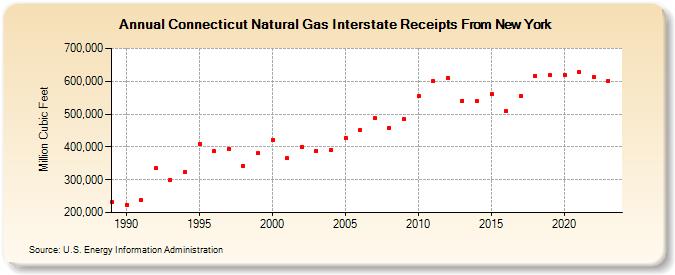
| Connecticut Natural Gas Interstate Receipts From New York (Million Cubic Feet) | |||||
| Decade | Year-0 | Year-1 | Year-2 | Year-3 | Year-4 | Year-5 | Year-6 | Year-7 | Year-8 | Year-9 |
|---|---|---|---|---|---|---|---|---|---|---|
| 1980's | 231,309 | |||||||||
| 1990's | 224,244 | 236,812 | 334,523 | 299,960 | 323,129 | 407,703 | 386,469 | 394,353 | 341,254 | 380,133 |
| 2000's | 420,822 | 364,678 | 399,070 | 388,700 | 389,823 | 427,335 | 451,516 | 488,568 | 458,858 | 484,299 |
| 2010's | 555,223 | 599,953 | 610,168 | 540,849 | 538,371 | 561,082 | 509,426 | 555,527 | 617,367 | 618,880 |
| 2020's | 618,360 | 627,499 | 612,099 |
| - = No Data Reported; -- = Not Applicable; NA = Not Available; W = Withheld to avoid disclosure of individual company data. |
| Release Date: 4/30/2024 |
| Next Release Date: 5/31/2024 |