|
Download Data (XLS File) |
|
|||||
|
|||||
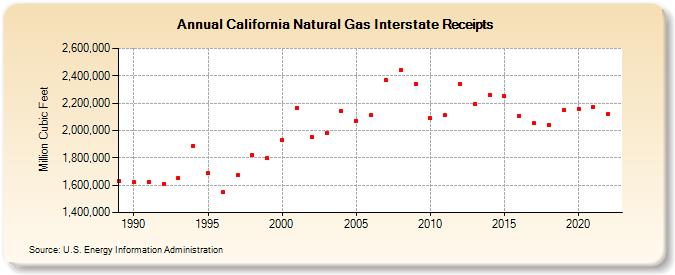
| California Natural Gas Interstate Receipts (Million Cubic Feet) | |||||
| Decade | Year-0 | Year-1 | Year-2 | Year-3 | Year-4 | Year-5 | Year-6 | Year-7 | Year-8 | Year-9 |
|---|---|---|---|---|---|---|---|---|---|---|
| 1980's | 1,627,420 | |||||||||
| 1990's | 1,620,132 | 1,623,693 | 1,610,708 | 1,654,143 | 1,887,149 | 1,690,530 | 1,547,503 | 1,671,128 | 1,820,433 | 1,795,215 |
| 2000's | 1,928,462 | 2,165,838 | 1,955,339 | 1,981,415 | 2,145,937 | 2,070,473 | 2,115,526 | 2,368,404 | 2,443,165 | 2,342,621 |
| 2010's | 2,090,195 | 2,109,607 | 2,342,250 | 2,192,192 | 2,260,465 | 2,251,949 | 2,108,051 | 2,052,586 | 2,043,322 | 2,149,615 |
| 2020's | 2,158,866 | 2,175,202 | 2,120,935 |
| - = No Data Reported; -- = Not Applicable; NA = Not Available; W = Withheld to avoid disclosure of individual company data. |
| Release Date: 3/29/2024 |
| Next Release Date: 4/30/2024 |