|
Download Data (XLS File) |
|
|||||
|
|||||
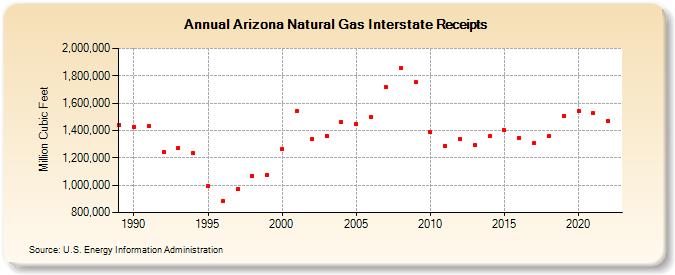
| Arizona Natural Gas Interstate Receipts (Million Cubic Feet) | |||||
| Decade | Year-0 | Year-1 | Year-2 | Year-3 | Year-4 | Year-5 | Year-6 | Year-7 | Year-8 | Year-9 |
|---|---|---|---|---|---|---|---|---|---|---|
| 1980's | 1,443,075 | |||||||||
| 1990's | 1,428,400 | 1,430,709 | 1,244,223 | 1,270,649 | 1,234,695 | 994,103 | 883,918 | 969,669 | 1,069,361 | 1,076,545 |
| 2000's | 1,262,272 | 1,539,775 | 1,335,254 | 1,360,744 | 1,460,182 | 1,444,317 | 1,496,283 | 1,715,762 | 1,858,155 | 1,752,883 |
| 2010's | 1,386,789 | 1,289,493 | 1,340,908 | 1,291,034 | 1,357,385 | 1,401,513 | 1,346,287 | 1,305,505 | 1,360,951 | 1,508,277 |
| 2020's | 1,539,987 | 1,525,705 | 1,469,597 |
| - = No Data Reported; -- = Not Applicable; NA = Not Available; W = Withheld to avoid disclosure of individual company data. |
| Release Date: 3/29/2024 |
| Next Release Date: 4/30/2024 |