|
Download Data (XLS File) |
|
|||||
|
|||||
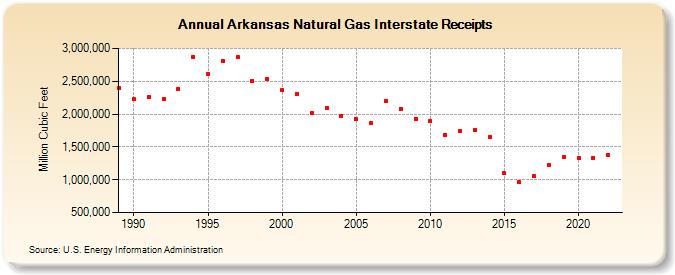
| Arkansas Natural Gas Interstate Receipts (Million Cubic Feet) | |||||
| Decade | Year-0 | Year-1 | Year-2 | Year-3 | Year-4 | Year-5 | Year-6 | Year-7 | Year-8 | Year-9 |
|---|---|---|---|---|---|---|---|---|---|---|
| 1980's | 2,393,404 | |||||||||
| 1990's | 2,223,388 | 2,263,622 | 2,235,546 | 2,384,562 | 2,865,799 | 2,614,855 | 2,810,961 | 2,872,118 | 2,510,822 | 2,529,375 |
| 2000's | 2,361,147 | 2,309,728 | 2,020,820 | 2,098,515 | 1,970,438 | 1,924,023 | 1,871,003 | 2,198,402 | 2,083,480 | 1,932,138 |
| 2010's | 1,893,630 | 1,681,506 | 1,746,379 | 1,761,879 | 1,651,592 | 1,097,450 | 961,150 | 1,050,081 | 1,222,799 | 1,346,754 |
| 2020's | 1,331,580 | 1,336,081 | 1,369,661 |
| - = No Data Reported; -- = Not Applicable; NA = Not Available; W = Withheld to avoid disclosure of individual company data. |
| Release Date: 3/29/2024 |
| Next Release Date: 4/30/2024 |