|
Download Data (XLS File) |
|
|||||
|
|||||
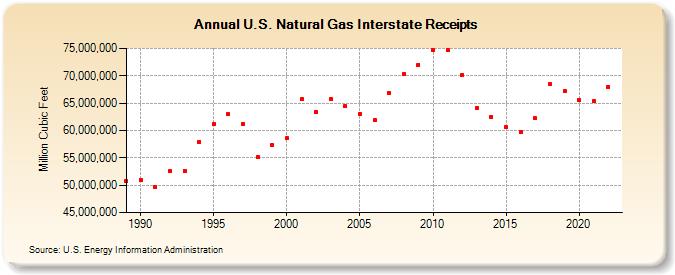
| U.S. Natural Gas Interstate Receipts (Million Cubic Feet) | |||||
| Decade | Year-0 | Year-1 | Year-2 | Year-3 | Year-4 | Year-5 | Year-6 | Year-7 | Year-8 | Year-9 |
|---|---|---|---|---|---|---|---|---|---|---|
| 1980's | 50,697,415 | |||||||||
| 1990's | 51,022,894 | 49,708,414 | 52,574,795 | 52,674,053 | 57,969,941 | 61,167,051 | 62,953,877 | 61,199,549 | 55,139,674 | 57,323,473 |
| 2000's | 58,570,289 | 65,774,849 | 63,389,468 | 65,793,961 | 64,423,388 | 63,027,775 | 61,863,323 | 66,858,134 | 70,305,954 | 72,022,602 |
| 2010's | 74,778,078 | 74,661,629 | 70,195,570 | 64,110,541 | 62,505,636 | 60,547,697 | 59,691,076 | 62,226,822 | 68,412,553 | 67,227,627 |
| 2020's | 65,582,472 | 65,363,752 | 67,977,990 |
| - = No Data Reported; -- = Not Applicable; NA = Not Available; W = Withheld to avoid disclosure of individual company data. |
| Release Date: 4/30/2024 |
| Next Release Date: 5/31/2024 |