|
Download Data (XLS File) |
|
|||||
|
|||||
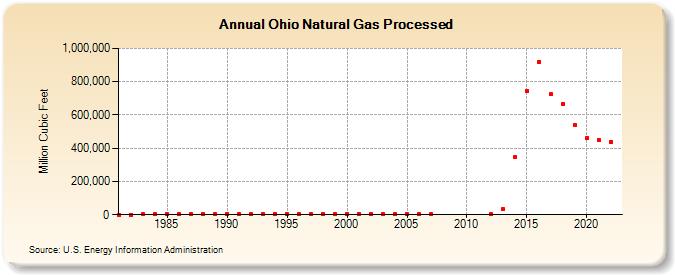
| Ohio Natural Gas Processed (Million Cubic Feet) | |||||
| Decade | Year-0 | Year-1 | Year-2 | Year-3 | Year-4 | Year-5 | Year-6 | Year-7 | Year-8 | Year-9 |
|---|---|---|---|---|---|---|---|---|---|---|
| 1980's | 207 | 670 | 1,713 | 2,263 | 2,591 | 2,555 | 3,036 | 2,812 | 2,608 | |
| 1990's | 3,081 | 2,615 | 2,730 | 2,989 | 2,930 | 2,257 | 2,477 | 2,553 | 2,895 | 2,933 |
| 2000's | 3,285 | 4,336 | 4,098 | 3,609 | 3,883 | 2,657 | 2,397 | 1,456 | ||
| 2010's | 2,211 | 33,031 | 344,073 | 745,715 | 916,699 | 723,435 | 667,738 | 536,490 | ||
| 2020's | 460,974 | 446,207 | 438,169 |
| - = No Data Reported; -- = Not Applicable; NA = Not Available; W = Withheld to avoid disclosure of individual company data. |
| Release Date: 8/30/2024 |
| Next Release Date: 9/30/2024 |