|
Download Data (XLS File) |
|
|||||
|
|||||
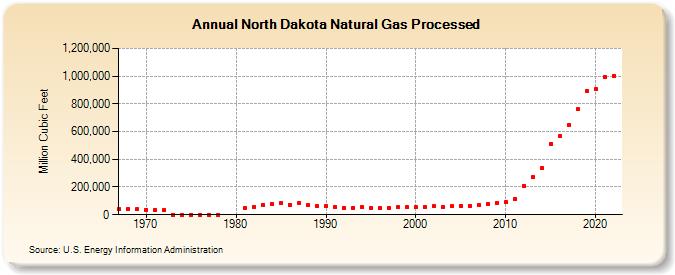
| North Dakota Natural Gas Processed (Million Cubic Feet) | |||||
| Decade | Year-0 | Year-1 | Year-2 | Year-3 | Year-4 | Year-5 | Year-6 | Year-7 | Year-8 | Year-9 |
|---|---|---|---|---|---|---|---|---|---|---|
| 1960's | 42,828 | 41,318 | 37,818 | |||||||
| 1970's | 36,830 | 33,252 | 32,131 | 0 | 0 | 0 | 0 | 0 | 0 | |
| 1980's | 50,900 | 57,608 | 71,745 | 77,524 | 81,008 | 72,678 | 86,329 | 67,867 | 59,841 | |
| 1990's | 62,042 | 59,228 | 50,462 | 51,713 | 55,150 | 49,861 | 47,942 | 51,657 | 52,777 | 52,191 |
| 2000's | 54,738 | 58,536 | 59,894 | 58,479 | 60,261 | 63,240 | 65,575 | 69,653 | 76,762 | 87,977 |
| 2010's | 91,539 | 112,206 | 208,598 | 270,001 | 337,490 | 512,684 | 567,262 | 645,414 | 759,388 | 893,160 |
| 2020's | 904,569 | 992,223 | 1,002,995 |
| - = No Data Reported; -- = Not Applicable; NA = Not Available; W = Withheld to avoid disclosure of individual company data. |
| Release Date: 3/29/2024 |
| Next Release Date: 4/30/2024 |