|
Download Data (XLS File) |
|
|||||
|
|||||
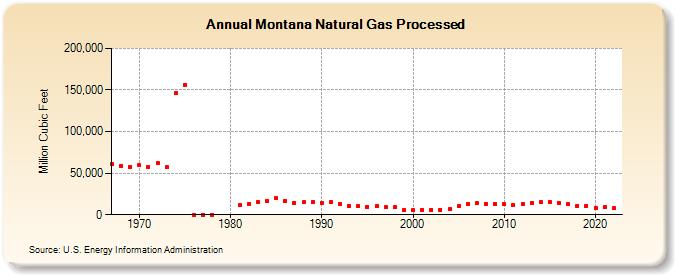
| Montana Natural Gas Processed (Million Cubic Feet) | |||||
| Decade | Year-0 | Year-1 | Year-2 | Year-3 | Year-4 | Year-5 | Year-6 | Year-7 | Year-8 | Year-9 |
|---|---|---|---|---|---|---|---|---|---|---|
| 1960's | 60,500 | 59,058 | 57,793 | |||||||
| 1970's | 59,193 | 57,105 | 61,757 | 56,960 | 146,907 | 156,203 | 0 | 0 | 0 | |
| 1980's | 11,825 | 13,169 | 15,093 | 16,349 | 19,793 | 16,212 | 14,177 | 15,230 | 15,475 | |
| 1990's | 14,629 | 14,864 | 12,697 | 11,010 | 10,418 | 9,413 | 10,141 | 8,859 | 8,715 | 5,211 |
| 2000's | 5,495 | 5,691 | 6,030 | 6,263 | 6,720 | 10,057 | 12,685 | 13,646 | 13,137 | 12,415 |
| 2010's | 12,391 | 11,185 | 12,727 | 14,575 | 14,751 | 15,146 | 13,565 | 12,468 | 11,035 | 10,737 |
| 2020's | 8,079 | 9,188 | 8,167 |
| - = No Data Reported; -- = Not Applicable; NA = Not Available; W = Withheld to avoid disclosure of individual company data. |
| Release Date: 3/29/2024 |
| Next Release Date: 4/30/2024 |