|
Download Data (XLS File) |
|
|||||
|
|||||
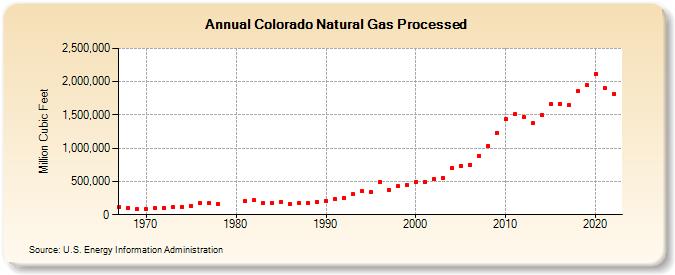
| Colorado Natural Gas Processed (Million Cubic Feet) | |||||
| Decade | Year-0 | Year-1 | Year-2 | Year-3 | Year-4 | Year-5 | Year-6 | Year-7 | Year-8 | Year-9 |
|---|---|---|---|---|---|---|---|---|---|---|
| 1960's | 112,440 | 96,397 | 85,171 | |||||||
| 1970's | 82,736 | 97,420 | 104,116 | 110,662 | 118,686 | 136,090 | 175,624 | 171,233 | 167,959 | |
| 1980's | 201,637 | 220,108 | 173,894 | 181,150 | 191,625 | 163,614 | 180,290 | 178,048 | 196,682 | |
| 1990's | 208,069 | 234,851 | 256,019 | 307,250 | 353,855 | 345,441 | 493,963 | 374,728 | 425,083 | 444,978 |
| 2000's | 494,581 | 497,385 | 534,295 | 555,544 | 703,804 | 730,948 | 751,036 | 888,705 | 1,029,641 | 1,233,260 |
| 2010's | 1,434,003 | 1,507,467 | 1,464,261 | 1,373,046 | 1,495,360 | 1,663,095 | 1,660,816 | 1,646,636 | 1,856,311 | 1,946,551 |
| 2020's | 2,119,984 | 1,901,192 | 1,821,715 |
| - = No Data Reported; -- = Not Applicable; NA = Not Available; W = Withheld to avoid disclosure of individual company data. |
| Release Date: 8/30/2024 |
| Next Release Date: 9/30/2024 |