|
Download Data (XLS File) |
|
|||||
|
|||||
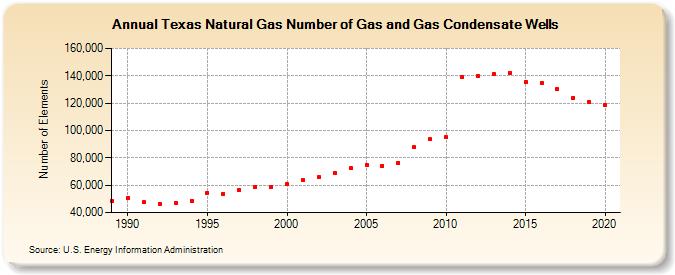
| Texas Natural Gas Number of Gas and Gas Condensate Wells (Number of Elements) | |||||
| Decade | Year-0 | Year-1 | Year-2 | Year-3 | Year-4 | Year-5 | Year-6 | Year-7 | Year-8 | Year-9 |
|---|---|---|---|---|---|---|---|---|---|---|
| 1980's | 48,609 | |||||||||
| 1990's | 50,867 | 47,615 | 46,298 | 47,101 | 48,654 | 54,635 | 53,816 | 56,747 | 58,736 | 58,712 |
| 2000's | 60,577 | 63,704 | 65,779 | 68,572 | 72,237 | 74,827 | 74,265 | 76,436 | 87,556 | 93,507 |
| 2010's | 95,014 | 139,368 | 140,087 | 140,964 | 142,292 | 135,560 | 134,958 | 130,033 | 123,928 | 120,576 |
| 2020's | 118,957 |
| - = No Data Reported; -- = Not Applicable; NA = Not Available; W = Withheld to avoid disclosure of individual company data. |
| Release Date: 4/30/2024 |
| Next Release Date: 5/31/2024 |