|
Download Data (XLS File) |
|
||||||||
|
||||||||
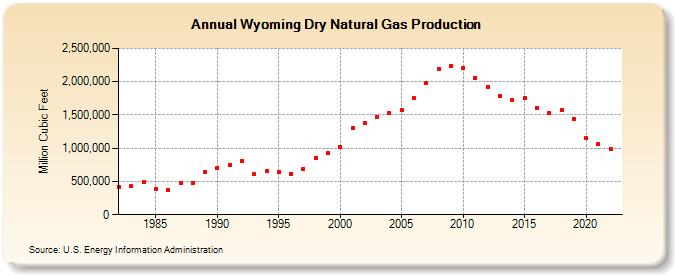
| Wyoming Dry Natural Gas Production (Million Cubic Feet) | ||||||||
| Decade | Year-0 | Year-1 | Year-2 | Year-3 | Year-4 | Year-5 | Year-6 | Year-7 | Year-8 | Year-9 |
|---|---|---|---|---|---|---|---|---|---|---|
| 1980's | 409,175 | 424,320 | 487,514 | 384,694 | 377,447 | 473,153 | 479,624 | 636,452 | ||
| 1990's | 707,137 | 745,058 | 811,198 | 605,839 | 662,532 | 637,717 | 617,782 | 689,035 | 859,478 | 920,591 |
| 2000's | 1,023,243 | 1,298,139 | 1,379,570 | 1,469,501 | 1,521,372 | 1,571,754 | 1,748,766 | 1,973,648 | 2,191,928 | 2,241,532 |
| 2010's | 2,212,748 | 2,061,834 | 1,919,726 | 1,783,798 | 1,717,470 | 1,759,967 | 1,606,284 | 1,528,311 | 1,572,514 | 1,433,806 |
| 2020's | 1,149,790 | 1,055,705 | 982,114 |
| - = No Data Reported; -- = Not Applicable; NA = Not Available; W = Withheld to avoid disclosure of individual company data. |
| Release Date: 3/29/2024 |
| Next Release Date: 4/30/2024 |