|
Download Data (XLS File) |
|
||||||||
|
||||||||
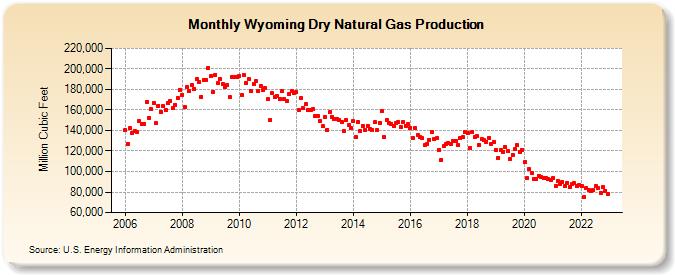
| Wyoming Dry Natural Gas Production (Million Cubic Feet) | ||||||||
| Year | Jan | Feb | Mar | Apr | May | Jun | Jul | Aug | Sep | Oct | Nov | Dec |
|---|---|---|---|---|---|---|---|---|---|---|---|---|
| 2006 | 140,315 | 127,195 | 142,024 | 137,452 | 139,641 | 138,682 | 148,930 | 146,759 | 146,638 | 167,924 | 152,523 | 160,683 |
| 2007 | 166,896 | 146,993 | 164,340 | 158,481 | 163,728 | 159,840 | 166,396 | 168,804 | 161,583 | 164,866 | 171,890 | 179,831 |
| 2008 | 175,028 | 162,752 | 182,223 | 178,266 | 184,184 | 180,655 | 189,720 | 187,104 | 172,883 | 189,055 | 189,099 | 200,959 |
| 2009 | 192,681 | 177,886 | 194,383 | 186,104 | 190,168 | 185,519 | 181,948 | 183,947 | 172,228 | 191,868 | 192,494 | 192,308 |
| 2010 | 193,239 | 174,720 | 194,306 | 186,131 | 189,993 | 178,231 | 185,635 | 188,010 | 178,190 | 183,556 | 179,603 | 181,133 |
| 2011 | 170,402 | 150,588 | 176,054 | 172,555 | 173,309 | 170,312 | 178,175 | 170,378 | 169,160 | 175,863 | 178,140 | 176,897 |
| 2012 | 177,961 | 160,309 | 171,407 | 161,772 | 165,335 | 160,117 | 160,161 | 160,489 | 154,369 | 154,222 | 149,493 | 144,091 |
| 2013 | 153,519 | 140,935 | 157,559 | 153,350 | 151,478 | 150,904 | 150,019 | 148,600 | 139,324 | 150,546 | 145,109 | 142,453 |
| 2014 | 148,793 | 133,188 | 148,278 | 139,906 | 144,662 | 140,865 | 144,175 | 141,354 | 140,747 | 147,894 | 140,228 | 147,380 |
| 2015 | 158,618 | 133,457 | 150,463 | 147,350 | 146,796 | 144,796 | 147,224 | 148,234 | 143,378 | 148,619 | 144,626 | 146,406 |
| 2016 | 142,820 | 132,822 | 142,525 | 135,968 | 133,610 | 132,397 | 125,543 | 127,091 | 131,183 | 138,436 | 131,600 | 132,287 |
| 2017 | 121,045 | 111,687 | 124,481 | 126,867 | 127,634 | 126,355 | 129,617 | 129,910 | 125,953 | 132,573 | 133,547 | 138,643 |
| 2018 | 137,716 | 122,819 | 138,101 | 133,652 | 134,706 | 125,622 | 131,269 | 130,330 | 129,177 | 133,077 | 127,278 | 128,767 |
| 2019 | 120,898 | 113,567 | 120,500 | 119,196 | 123,718 | 119,876 | 112,143 | 116,232 | 122,079 | 125,447 | 119,161 | 120,990 |
| 2020 | 108,980 | 93,228 | 102,004 | 98,110 | 92,879 | 92,577 | 95,894 | 94,691 | 93,669 | 93,605 | 92,244 | 91,909 |
| 2021 | 93,232 | 85,651 | 90,690 | 87,948 | 89,764 | 85,864 | 89,054 | 85,152 | 87,627 | 88,405 | 85,519 | 86,800 |
| 2022 | 85,534 | 74,855 | 83,785 | 82,385 | 81,336 | 81,828 | 85,561 | 83,454 | 79,072 | 84,534 | 81,358 | 78,412 |
| - = No Data Reported; -- = Not Applicable; NA = Not Available; W = Withheld to avoid disclosure of individual company data. |
| Release Date: 3/29/2024 |
| Next Release Date: 4/30/2024 |