|
Download Data (XLS File) |
|
||||||||
|
||||||||
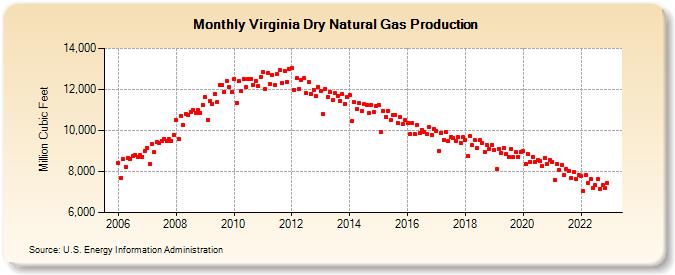
| Virginia Dry Natural Gas Production (Million Cubic Feet) | ||||||||
| Year | Jan | Feb | Mar | Apr | May | Jun | Jul | Aug | Sep | Oct | Nov | Dec |
|---|---|---|---|---|---|---|---|---|---|---|---|---|
| 2006 | 8,410 | 7,694 | 8,597 | 8,227 | 8,671 | 8,619 | 8,741 | 8,829 | 8,709 | 8,803 | 8,721 | 9,005 |
| 2007 | 9,148 | 8,368 | 9,350 | 8,949 | 9,431 | 9,373 | 9,507 | 9,602 | 9,472 | 9,575 | 9,485 | 9,795 |
| 2008 | 10,492 | 9,594 | 10,715 | 10,259 | 10,812 | 10,742 | 10,897 | 11,008 | 10,856 | 10,976 | 10,872 | 11,232 |
| 2009 | 11,622 | 10,525 | 11,426 | 11,297 | 11,760 | 11,406 | 12,201 | 12,234 | 11,878 | 12,407 | 12,107 | 11,875 |
| 2010 | 12,528 | 11,363 | 12,405 | 11,914 | 12,502 | 12,105 | 12,490 | 12,520 | 12,229 | 12,417 | 12,190 | 12,593 |
| 2011 | 12,845 | 12,027 | 12,789 | 12,268 | 12,697 | 12,218 | 12,740 | 12,943 | 12,307 | 12,897 | 12,380 | 12,984 |
| 2012 | 13,045 | 11,995 | 12,541 | 12,023 | 12,481 | 12,549 | 11,811 | 12,368 | 11,788 | 11,988 | 11,689 | 12,129 |
| 2013 | 11,915 | 10,782 | 12,024 | 11,650 | 11,871 | 11,471 | 11,822 | 11,703 | 11,430 | 11,787 | 11,298 | 11,630 |
| 2014 | 11,732 | 10,469 | 11,364 | 11,068 | 11,356 | 10,946 | 11,269 | 11,264 | 10,867 | 11,265 | 10,885 | 11,176 |
| 2015 | 11,245 | 9,905 | 10,962 | 10,672 | 10,965 | 10,487 | 10,766 | 10,745 | 10,358 | 10,657 | 10,292 | 10,533 |
| 2016 | 10,359 | 9,814 | 10,365 | 9,837 | 10,267 | 9,868 | 10,045 | 9,917 | 9,819 | 10,154 | 9,785 | 10,058 |
| 2017 | 9,984 | 9,023 | 9,894 | 9,550 | 9,934 | 9,489 | 9,689 | 9,624 | 9,502 | 9,677 | 9,413 | 9,672 |
| 2018 | 9,553 | 8,752 | 9,720 | 9,278 | 9,515 | 9,127 | 9,518 | 9,371 | 8,957 | 9,288 | 9,088 | 9,310 |
| 2019 | 9,053 | 8,120 | 9,114 | 8,911 | 9,159 | 8,840 | 8,704 | 9,091 | 8,701 | 8,930 | 8,720 | 8,967 |
| 2020 | 8,988 | 8,376 | 8,855 | 8,486 | 8,723 | 8,457 | 8,539 | 8,505 | 8,252 | 8,668 | 8,359 | 8,576 |
| 2021 | 8,477 | 7,603 | 8,383 | 8,077 | 8,335 | 7,852 | 8,124 | 8,036 | 7,687 | 7,954 | 7,615 | 7,829 |
| 2022 | 7,761 | 7,033 | 7,819 | 7,439 | 7,617 | 7,197 | 7,342 | 7,621 | 7,144 | 7,320 | 7,202 | 7,442 |
| - = No Data Reported; -- = Not Applicable; NA = Not Available; W = Withheld to avoid disclosure of individual company data. |
| Release Date: 8/30/2024 |
| Next Release Date: 9/30/2024 |