|
Download Data (XLS File) |
|
||||||||
|
||||||||
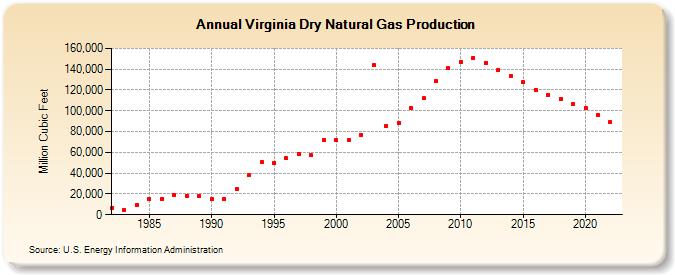
| Virginia Dry Natural Gas Production (Million Cubic Feet) | ||||||||
| Decade | Year-0 | Year-1 | Year-2 | Year-3 | Year-4 | Year-5 | Year-6 | Year-7 | Year-8 | Year-9 |
|---|---|---|---|---|---|---|---|---|---|---|
| 1980's | 6,880 | 4,346 | 8,901 | 15,041 | 15,427 | 19,223 | 18,424 | 17,935 | ||
| 1990's | 14,774 | 14,906 | 24,733 | 37,840 | 50,259 | 49,818 | 54,290 | 58,249 | 57,263 | 72,189 |
| 2000's | 71,545 | 71,543 | 76,915 | 143,644 | 85,508 | 88,610 | 103,027 | 112,057 | 128,454 | 140,738 |
| 2010's | 147,255 | 151,094 | 146,405 | 139,382 | 133,661 | 127,586 | 120,288 | 115,452 | 111,476 | 106,311 |
| 2020's | 102,784 | 95,972 | 88,937 |
| - = No Data Reported; -- = Not Applicable; NA = Not Available; W = Withheld to avoid disclosure of individual company data. |
| Release Date: 3/29/2024 |
| Next Release Date: 4/30/2024 |