|
Download Data (XLS File) |
|
||||||||
|
||||||||
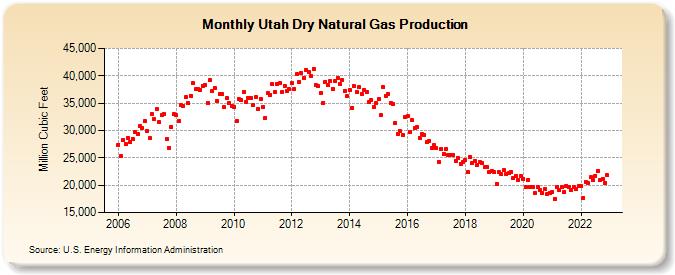
| Utah Dry Natural Gas Production (Million Cubic Feet) | ||||||||
| Year | Jan | Feb | Mar | Apr | May | Jun | Jul | Aug | Sep | Oct | Nov | Dec |
|---|---|---|---|---|---|---|---|---|---|---|---|---|
| 2006 | 27,437 | 25,286 | 28,290 | 27,483 | 28,644 | 27,847 | 28,492 | 29,681 | 29,397 | 30,752 | 30,381 | 31,719 |
| 2007 | 29,988 | 28,560 | 33,003 | 32,061 | 33,877 | 31,501 | 32,760 | 33,005 | 28,517 | 26,805 | 30,668 | 32,935 |
| 2008 | 32,803 | 31,759 | 34,564 | 34,498 | 36,027 | 34,967 | 36,376 | 38,620 | 37,492 | 37,537 | 37,429 | 38,213 |
| 2009 | 38,301 | 35,045 | 39,153 | 37,217 | 37,721 | 35,385 | 36,704 | 36,646 | 34,201 | 35,878 | 35,013 | 34,409 |
| 2010 | 34,299 | 31,732 | 35,722 | 35,570 | 37,007 | 35,259 | 35,850 | 35,972 | 34,721 | 36,116 | 33,992 | 35,826 |
| 2011 | 34,371 | 32,283 | 36,835 | 36,532 | 38,412 | 37,118 | 38,565 | 38,651 | 37,006 | 38,208 | 37,125 | 37,510 |
| 2012 | 38,604 | 37,588 | 40,266 | 38,899 | 40,487 | 39,637 | 41,129 | 40,616 | 39,951 | 41,276 | 38,226 | 38,077 |
| 2013 | 36,786 | 35,084 | 38,926 | 38,327 | 39,045 | 37,590 | 38,957 | 39,595 | 38,457 | 39,199 | 37,268 | 36,218 |
| 2014 | 37,365 | 34,176 | 38,056 | 37,066 | 37,928 | 36,752 | 37,460 | 36,966 | 35,193 | 35,584 | 34,298 | 35,047 |
| 2015 | 35,775 | 32,794 | 37,906 | 36,334 | 36,723 | 34,946 | 34,852 | 31,387 | 29,391 | 29,848 | 29,217 | 32,549 |
| 2016 | 32,592 | 29,712 | 31,857 | 30,381 | 30,583 | 28,686 | 29,288 | 29,250 | 27,837 | 28,147 | 26,837 | 27,267 |
| 2017 | 26,828 | 24,245 | 26,634 | 25,750 | 26,641 | 25,429 | 25,553 | 25,485 | 24,492 | 24,988 | 23,964 | 24,258 |
| 2018 | 24,634 | 22,384 | 25,225 | 24,111 | 24,447 | 23,680 | 24,168 | 24,045 | 23,235 | 23,345 | 22,402 | 22,588 |
| 2019 | 22,360 | 20,291 | 22,470 | 21,976 | 22,724 | 21,997 | 22,173 | 22,427 | 21,271 | 21,715 | 21,040 | 21,713 |
| 2020 | 21,155 | 19,655 | 20,995 | 19,648 | 19,616 | 18,550 | 19,582 | 19,087 | 18,577 | 19,297 | 18,474 | 18,579 |
| 2021 | 18,673 | 17,525 | 19,679 | 19,076 | 19,583 | 18,817 | 19,866 | 19,610 | 19,210 | 19,706 | 19,266 | 19,773 |
| 2022 | 19,860 | 17,742 | 20,630 | 20,393 | 21,421 | 20,927 | 21,749 | 22,648 | 20,965 | 21,190 | 20,413 | 21,780 |
| - = No Data Reported; -- = Not Applicable; NA = Not Available; W = Withheld to avoid disclosure of individual company data. |
| Release Date: 3/29/2024 |
| Next Release Date: 4/30/2024 |