|
Download Data (XLS File) |
|
||||||||
|
||||||||
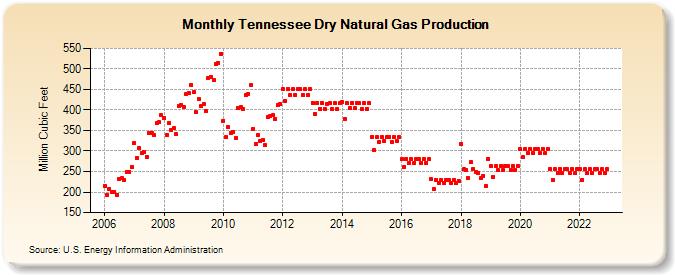
| Tennessee Dry Natural Gas Production (Million Cubic Feet) | ||||||||
| Year | Jan | Feb | Mar | Apr | May | Jun | Jul | Aug | Sep | Oct | Nov | Dec |
|---|---|---|---|---|---|---|---|---|---|---|---|---|
| 2006 | 215 | 192 | 208 | 199 | 201 | 193 | 232 | 233 | 230 | 249 | 250 | 261 |
| 2007 | 319 | 284 | 308 | 295 | 298 | 286 | 344 | 345 | 340 | 368 | 370 | 387 |
| 2008 | 380 | 339 | 367 | 351 | 355 | 341 | 410 | 412 | 406 | 439 | 441 | 461 |
| 2009 | 443 | 395 | 427 | 409 | 414 | 397 | 478 | 480 | 473 | 511 | 514 | 537 |
| 2010 | 374 | 333 | 359 | 344 | 346 | 332 | 405 | 407 | 402 | 436 | 440 | 460 |
| 2011 | 354 | 317 | 340 | 324 | 327 | 314 | 384 | 385 | 387 | 378 | 413 | 414 |
| 2012 | 451 | 422 | 451 | 437 | 451 | 437 | 451 | 451 | 436 | 450 | 436 | 451 |
| 2013 | 417 | 391 | 417 | 403 | 416 | 403 | 415 | 416 | 402 | 416 | 402 | 416 |
| 2014 | 419 | 378 | 418 | 404 | 418 | 404 | 417 | 416 | 403 | 416 | 403 | 416 |
| 2015 | 335 | 302 | 334 | 323 | 334 | 324 | 334 | 334 | 323 | 334 | 324 | 334 |
| 2016 | 280 | 261 | 280 | 271 | 280 | 271 | 280 | 280 | 271 | 280 | 271 | 280 |
| 2017 | 231 | 208 | 230 | 223 | 230 | 223 | 230 | 230 | 222 | 229 | 221 | 228 |
| 2018 | 318 | 255 | 254 | 234 | 272 | 256 | 250 | 247 | 233 | 240 | 215 | 281 |
| 2019 | 263 | 237 | 263 | 254 | 263 | 254 | 263 | 263 | 254 | 263 | 254 | 263 |
| 2020 | 304 | 285 | 304 | 295 | 305 | 295 | 305 | 305 | 295 | 305 | 295 | 305 |
| 2021 | 255 | 230 | 255 | 247 | 255 | 247 | 255 | 255 | 247 | 255 | 246 | 255 |
| 2022 | 255 | 230 | 255 | 247 | 255 | 247 | 255 | 255 | 247 | 255 | 247 | 255 |
| - = No Data Reported; -- = Not Applicable; NA = Not Available; W = Withheld to avoid disclosure of individual company data. |
| Release Date: 3/29/2024 |
| Next Release Date: 4/30/2024 |