|
Download Data (XLS File) |
|
||||||||
|
||||||||
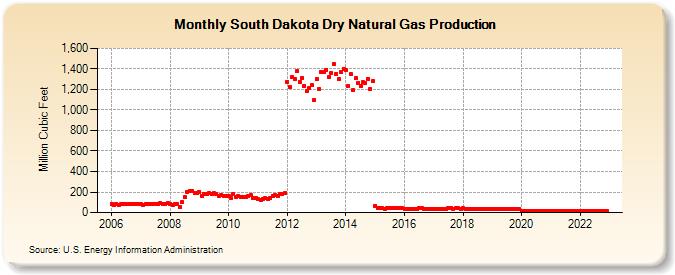
| South Dakota Dry Natural Gas Production (Million Cubic Feet) | ||||||||
| Year | Jan | Feb | Mar | Apr | May | Jun | Jul | Aug | Sep | Oct | Nov | Dec |
|---|---|---|---|---|---|---|---|---|---|---|---|---|
| 2006 | 85 | 78 | 84 | 73 | 81 | 80 | 81 | 80 | 79 | 83 | 79 | 80 |
| 2007 | 80 | 72 | 84 | 81 | 82 | 81 | 84 | 83 | 90 | 79 | 88 | 93 |
| 2008 | 88 | 76 | 82 | 81 | 57 | 101 | 148 | 203 | 212 | 214 | 193 | 190 |
| 2009 | 201 | 166 | 180 | 179 | 190 | 183 | 187 | 180 | 163 | 173 | 163 | 166 |
| 2010 | 158 | 144 | 179 | 152 | 159 | 151 | 149 | 153 | 162 | 168 | 146 | 142 |
| 2011 | 128 | 121 | 134 | 138 | 135 | 145 | 165 | 170 | 166 | 181 | 178 | 188 |
| 2012 | 1,277 | 1,224 | 1,321 | 1,301 | 1,377 | 1,275 | 1,313 | 1,236 | 1,185 | 1,210 | 1,240 | 1,095 |
| 2013 | 1,303 | 1,205 | 1,367 | 1,369 | 1,390 | 1,317 | 1,360 | 1,449 | 1,355 | 1,300 | 1,366 | 1,398 |
| 2014 | 1,387 | 1,237 | 1,349 | 1,191 | 1,307 | 1,264 | 1,231 | 1,268 | 1,263 | 1,306 | 1,200 | 1,282 |
| 2015 | 67 | 41 | 48 | 44 | 37 | 43 | 43 | 44 | 41 | 42 | 41 | 43 |
| 2016 | 35 | 32 | 34 | 33 | 36 | 38 | 40 | 40 | 36 | 38 | 38 | 35 |
| 2017 | 34 | 32 | 38 | 37 | 39 | 39 | 40 | 42 | 39 | 41 | 40 | 39 |
| 2018 | 40 | 34 | 36 | 36 | 38 | 37 | 36 | 35 | 36 | 38 | 36 | 36 |
| 2019 | 36 | 33 | 34 | 34 | 31 | 33 | 35 | 35 | 32 | 38 | 36 | 37 |
| 2020 | 15 | 14 | 14 | 12 | 12 | 12 | 14 | 14 | 12 | 14 | 13 | 14 |
| 2021 | 15 | 12 | 14 | 13 | 14 | 14 | 14 | 14 | 12 | 13 | 14 | 14 |
| 2022 | 13 | 13 | 14 | 14 | 14 | 14 | 13 | 13 | 14 | 15 | 14 | 14 |
| - = No Data Reported; -- = Not Applicable; NA = Not Available; W = Withheld to avoid disclosure of individual company data. |
| Release Date: 3/29/2024 |
| Next Release Date: 4/30/2024 |