|
Download Data (XLS File) |
|
||||||||
|
||||||||
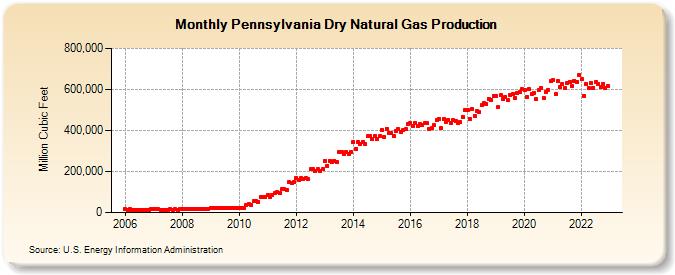
| Pennsylvania Dry Natural Gas Production (Million Cubic Feet) | ||||||||
| Year | Jan | Feb | Mar | Apr | May | Jun | Jul | Aug | Sep | Oct | Nov | Dec |
|---|---|---|---|---|---|---|---|---|---|---|---|---|
| 2006 | 15,535 | 14,899 | 15,034 | 14,005 | 14,160 | 14,321 | 14,028 | 14,483 | 14,369 | 14,856 | 13,892 | 15,574 |
| 2007 | 16,091 | 15,432 | 15,572 | 14,506 | 14,665 | 14,833 | 14,530 | 15,001 | 14,883 | 15,387 | 14,388 | 16,130 |
| 2008 | 17,498 | 16,779 | 16,933 | 15,773 | 15,947 | 16,130 | 15,797 | 16,312 | 16,194 | 16,736 | 15,647 | 17,542 |
| 2009 | 24,171 | 23,181 | 23,393 | 21,793 | 22,033 | 22,286 | 21,831 | 22,539 | 22,364 | 23,121 | 21,622 | 24,240 |
| 2010 | 22,335 | 20,167 | 22,326 | 38,154 | 39,423 | 38,156 | 54,758 | 54,755 | 52,986 | 75,906 | 73,457 | 75,900 |
| 2011 | 83,547 | 75,475 | 83,529 | 94,626 | 97,779 | 94,628 | 113,493 | 113,484 | 109,824 | 146,675 | 141,934 | 146,669 |
| 2012 | 169,591 | 158,668 | 169,607 | 164,138 | 169,605 | 164,141 | 210,420 | 210,425 | 203,631 | 210,417 | 203,628 | 210,424 |
| 2013 | 252,976 | 228,490 | 252,976 | 244,793 | 252,959 | 244,802 | 296,706 | 296,710 | 287,143 | 296,709 | 287,120 | 296,721 |
| 2014 | 345,037 | 311,578 | 344,938 | 333,733 | 344,876 | 333,734 | 371,323 | 371,304 | 359,328 | 371,271 | 359,316 | 371,266 |
| 2015 | 403,515 | 366,748 | 408,609 | 388,289 | 386,787 | 372,468 | 397,227 | 405,216 | 393,675 | 402,684 | 404,960 | 429,264 |
| 2016 | 436,536 | 420,649 | 438,396 | 420,705 | 433,468 | 425,538 | 434,741 | 434,123 | 408,767 | 411,729 | 426,121 | 450,662 |
| 2017 | 454,932 | 409,884 | 454,147 | 441,595 | 452,211 | 437,451 | 450,716 | 443,895 | 437,276 | 441,140 | 467,323 | 499,214 |
| 2018 | 499,667 | 457,827 | 505,072 | 472,272 | 497,313 | 489,584 | 524,370 | 533,553 | 529,904 | 554,689 | 546,787 | 566,049 |
| 2019 | 568,643 | 512,711 | 570,934 | 552,394 | 563,818 | 548,960 | 575,135 | 577,158 | 560,635 | 581,449 | 589,565 | 599,864 |
| 2020 | 598,873 | 565,016 | 599,971 | 579,378 | 584,879 | 553,284 | 596,928 | 607,808 | 559,373 | 588,052 | 597,650 | 639,829 |
| 2021 | 643,972 | 578,343 | 641,001 | 612,009 | 627,041 | 608,054 | 629,630 | 638,144 | 618,999 | 642,955 | 637,849 | 669,159 |
| 2022 | 649,567 | 570,003 | 626,164 | 606,612 | 630,240 | 608,580 | 635,645 | 626,967 | 610,081 | 628,500 | 604,727 | 616,033 |
| - = No Data Reported; -- = Not Applicable; NA = Not Available; W = Withheld to avoid disclosure of individual company data. |
| Release Date: 4/30/2024 |
| Next Release Date: 5/31/2024 |