|
Download Data (XLS File) |
|
||||||||
|
||||||||
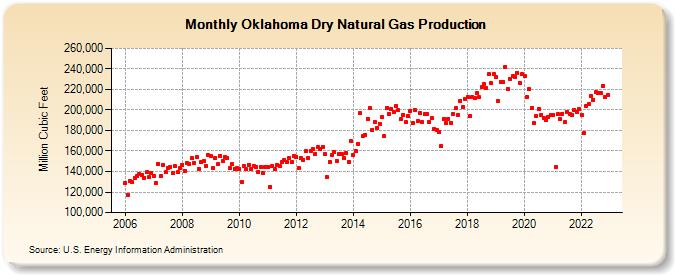
| Oklahoma Dry Natural Gas Production (Million Cubic Feet) | ||||||||
| Year | Jan | Feb | Mar | Apr | May | Jun | Jul | Aug | Sep | Oct | Nov | Dec |
|---|---|---|---|---|---|---|---|---|---|---|---|---|
| 2006 | 129,135 | 117,495 | 130,894 | 129,451 | 133,836 | 135,150 | 137,891 | 136,729 | 133,990 | 139,235 | 134,308 | 138,934 |
| 2007 | 135,745 | 128,559 | 147,430 | 135,563 | 146,113 | 139,520 | 143,803 | 144,436 | 138,754 | 144,998 | 139,076 | 143,042 |
| 2008 | 146,796 | 140,901 | 148,341 | 147,602 | 152,741 | 148,502 | 153,761 | 142,734 | 148,998 | 150,213 | 145,633 | 155,799 |
| 2009 | 155,239 | 143,226 | 153,344 | 146,913 | 155,448 | 150,595 | 154,540 | 152,852 | 143,223 | 147,247 | 142,838 | 143,200 |
| 2010 | 142,477 | 130,222 | 145,015 | 141,968 | 146,833 | 142,340 | 145,731 | 144,139 | 140,015 | 144,884 | 138,649 | 144,426 |
| 2011 | 144,051 | 125,088 | 144,947 | 142,355 | 146,378 | 145,008 | 149,423 | 151,181 | 149,111 | 153,572 | 149,082 | 154,641 |
| 2012 | 154,177 | 143,202 | 152,720 | 151,602 | 159,669 | 152,927 | 159,772 | 162,284 | 157,519 | 163,882 | 161,639 | 164,141 |
| 2013 | 156,596 | 134,612 | 149,669 | 156,536 | 159,291 | 150,704 | 156,844 | 157,249 | 152,723 | 157,934 | 149,625 | 169,376 |
| 2014 | 155,959 | 159,543 | 167,178 | 196,948 | 174,780 | 175,971 | 191,056 | 201,677 | 180,902 | 188,088 | 182,322 | 186,797 |
| 2015 | 193,071 | 174,264 | 202,191 | 196,361 | 200,765 | 197,685 | 203,998 | 199,629 | 190,761 | 195,456 | 188,135 | 193,874 |
| 2016 | 199,042 | 187,066 | 199,561 | 189,019 | 197,018 | 187,879 | 195,821 | 196,539 | 188,091 | 191,700 | 181,193 | 180,943 |
| 2017 | 178,129 | 164,695 | 191,614 | 187,491 | 191,488 | 187,665 | 196,272 | 201,526 | 195,179 | 209,106 | 202,737 | 210,791 |
| 2018 | 212,841 | 194,247 | 212,439 | 211,796 | 216,635 | 212,270 | 221,955 | 225,608 | 221,451 | 234,615 | 226,144 | 235,238 |
| 2019 | 231,707 | 208,479 | 227,354 | 227,398 | 242,154 | 220,185 | 230,651 | 232,855 | 232,134 | 236,500 | 226,608 | 234,570 |
| 2020 | 232,733 | 212,418 | 220,187 | 201,612 | 187,269 | 194,214 | 200,886 | 195,342 | 191,804 | 190,661 | 193,497 | 195,316 |
| 2021 | 195,102 | 144,413 | 195,879 | 190,817 | 196,316 | 187,978 | 197,958 | 196,163 | 194,689 | 199,615 | 198,042 | 200,477 |
| 2022 | 195,295 | 177,656 | 203,844 | 205,647 | 213,816 | 210,169 | 217,248 | 216,545 | 216,441 | 223,386 | 212,916 | 214,498 |
| - = No Data Reported; -- = Not Applicable; NA = Not Available; W = Withheld to avoid disclosure of individual company data. |
| Release Date: 3/29/2024 |
| Next Release Date: 4/30/2024 |