|
Download Data (XLS File) |
|
||||||||
|
||||||||
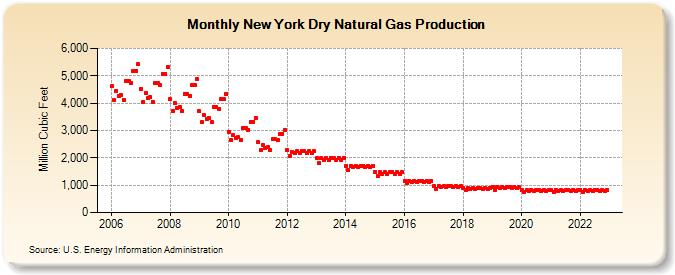
| New York Dry Natural Gas Production (Million Cubic Feet) | ||||||||
| Year | Jan | Feb | Mar | Apr | May | Jun | Jul | Aug | Sep | Oct | Nov | Dec |
|---|---|---|---|---|---|---|---|---|---|---|---|---|
| 2006 | 4,613 | 4,122 | 4,443 | 4,261 | 4,291 | 4,119 | 4,821 | 4,809 | 4,741 | 5,168 | 5,174 | 5,419 |
| 2007 | 4,528 | 4,046 | 4,360 | 4,182 | 4,211 | 4,042 | 4,732 | 4,720 | 4,653 | 5,072 | 5,078 | 5,318 |
| 2008 | 4,147 | 3,705 | 3,994 | 3,830 | 3,857 | 3,702 | 4,334 | 4,323 | 4,262 | 4,645 | 4,651 | 4,871 |
| 2009 | 3,696 | 3,303 | 3,559 | 3,413 | 3,438 | 3,300 | 3,863 | 3,853 | 3,798 | 4,140 | 4,145 | 4,341 |
| 2010 | 2,951 | 2,637 | 2,842 | 2,726 | 2,745 | 2,635 | 3,084 | 3,077 | 3,033 | 3,306 | 3,310 | 3,467 |
| 2011 | 2,565 | 2,292 | 2,470 | 2,369 | 2,386 | 2,290 | 2,681 | 2,674 | 2,636 | 2,873 | 2,877 | 3,013 |
| 2012 | 2,277 | 2,085 | 2,229 | 2,159 | 2,233 | 2,162 | 2,235 | 2,236 | 2,165 | 2,238 | 2,166 | 2,238 |
| 2013 | 1,992 | 1,800 | 1,992 | 1,928 | 1,992 | 1,928 | 1,992 | 1,992 | 1,928 | 1,992 | 1,928 | 1,992 |
| 2014 | 1,716 | 1,550 | 1,716 | 1,660 | 1,716 | 1,660 | 1,716 | 1,716 | 1,660 | 1,716 | 1,660 | 1,716 |
| 2015 | 1,471 | 1,329 | 1,471 | 1,424 | 1,471 | 1,424 | 1,471 | 1,471 | 1,424 | 1,471 | 1,424 | 1,471 |
| 2016 | 1,145 | 1,071 | 1,145 | 1,108 | 1,145 | 1,108 | 1,145 | 1,145 | 1,108 | 1,145 | 1,108 | 1,145 |
| 2017 | 968 | 874 | 968 | 937 | 968 | 937 | 968 | 968 | 937 | 968 | 937 | 968 |
| 2018 | 905 | 817 | 905 | 876 | 905 | 876 | 905 | 905 | 876 | 905 | 876 | 905 |
| 2019 | 931 | 841 | 931 | 901 | 931 | 901 | 931 | 931 | 901 | 931 | 901 | 931 |
| 2020 | 818 | 765 | 818 | 792 | 818 | 792 | 818 | 818 | 792 | 818 | 792 | 818 |
| 2021 | 824 | 745 | 824 | 798 | 824 | 798 | 824 | 824 | 798 | 824 | 798 | 824 |
| 2022 | 827 | 747 | 827 | 800 | 827 | 800 | 827 | 827 | 800 | 827 | 800 | 827 |
| - = No Data Reported; -- = Not Applicable; NA = Not Available; W = Withheld to avoid disclosure of individual company data. |
| Release Date: 8/30/2024 |
| Next Release Date: 9/30/2024 |