|
Download Data (XLS File) |
|
||||||||
|
||||||||
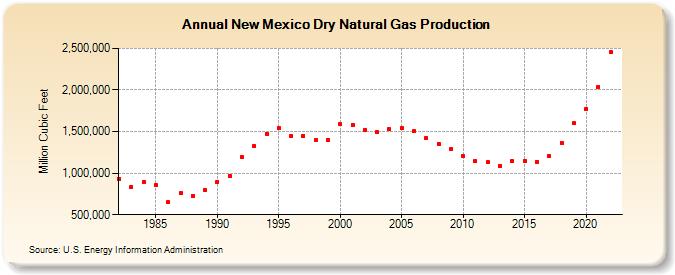
| New Mexico Dry Natural Gas Production (Million Cubic Feet) | ||||||||
| Decade | Year-0 | Year-1 | Year-2 | Year-3 | Year-4 | Year-5 | Year-6 | Year-7 | Year-8 | Year-9 |
|---|---|---|---|---|---|---|---|---|---|---|
| 1980's | 934,321 | 838,975 | 898,786 | 851,319 | 651,319 | 758,617 | 728,464 | 793,021 | ||
| 1990's | 898,478 | 967,821 | 1,193,343 | 1,326,236 | 1,471,082 | 1,540,169 | 1,445,746 | 1,449,587 | 1,394,433 | 1,403,821 |
| 2000's | 1,584,884 | 1,580,167 | 1,522,044 | 1,492,723 | 1,527,127 | 1,544,102 | 1,509,252 | 1,421,672 | 1,353,625 | 1,288,164 |
| 2010's | 1,200,222 | 1,147,012 | 1,131,211 | 1,084,845 | 1,140,626 | 1,151,493 | 1,139,826 | 1,203,206 | 1,367,940 | 1,599,175 |
| 2020's | 1,775,591 | 2,040,908 | 2,454,058 |
| - = No Data Reported; -- = Not Applicable; NA = Not Available; W = Withheld to avoid disclosure of individual company data. |
| Release Date: 3/29/2024 |
| Next Release Date: 4/30/2024 |