|
Download Data (XLS File) |
|
||||||||
|
||||||||
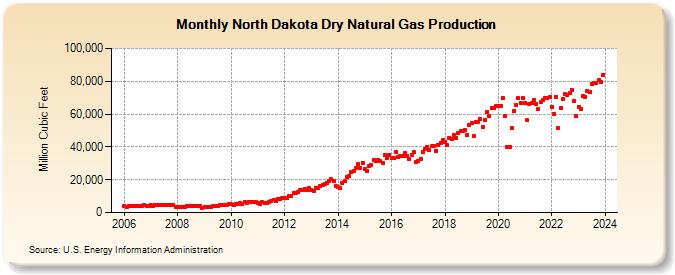
| North Dakota Dry Natural Gas Production (Million Cubic Feet) | ||||||||
| Year | Jan | Feb | Mar | Apr | May | Jun | Jul | Aug | Sep | Oct | Nov | Dec |
|---|---|---|---|---|---|---|---|---|---|---|---|---|
| 2006 | 3,771 | 3,299 | 3,804 | 3,813 | 3,983 | 3,930 | 4,094 | 4,171 | 4,246 | 4,415 | 4,230 | 4,263 |
| 2007 | 4,435 | 4,028 | 4,338 | 4,314 | 4,459 | 4,436 | 4,653 | 4,833 | 4,576 | 4,609 | 4,543 | 3,593 |
| 2008 | 3,423 | 3,225 | 3,449 | 3,499 | 3,819 | 4,025 | 4,087 | 4,155 | 4,245 | 4,154 | 4,001 | 2,486 |
| 2009 | 3,345 | 3,148 | 3,575 | 3,684 | 3,908 | 3,912 | 4,295 | 4,439 | 4,340 | 4,525 | 4,628 | 5,432 |
| 2010 | 5,032 | 4,753 | 5,480 | 5,497 | 5,995 | 5,315 | 6,372 | 5,999 | 6,498 | 6,650 | 6,497 | 6,368 |
| 2011 | 6,124 | 5,393 | 6,212 | 5,812 | 6,025 | 6,145 | 7,170 | 7,580 | 7,341 | 8,188 | 8,246 | 8,685 |
| 2012 | 9,098 | 8,975 | 10,286 | 10,117 | 11,797 | 11,895 | 12,555 | 13,899 | 13,939 | 14,468 | 13,933 | 15,166 |
| 2013 | 13,784 | 12,963 | 14,966 | 14,719 | 15,941 | 16,584 | 17,183 | 18,287 | 19,044 | 20,173 | 19,091 | 16,137 |
| 2014 | 15,541 | 14,934 | 17,782 | 19,316 | 21,926 | 22,137 | 24,631 | 25,425 | 27,046 | 29,442 | 27,329 | 30,390 |
| 2015 | 26,305 | 25,122 | 28,645 | 28,896 | 32,049 | 31,634 | 31,929 | 31,211 | 30,192 | 34,819 | 33,504 | 34,937 |
| 2016 | 33,336 | 33,193 | 36,953 | 34,050 | 34,509 | 34,527 | 36,157 | 34,249 | 32,528 | 34,932 | 36,949 | 30,668 |
| 2017 | 31,476 | 32,841 | 36,914 | 38,476 | 39,974 | 37,930 | 40,333 | 40,787 | 37,658 | 41,365 | 42,617 | 43,955 |
| 2018 | 43,070 | 40,919 | 45,672 | 45,068 | 47,237 | 45,508 | 48,556 | 49,827 | 49,921 | 50,291 | 47,092 | 53,151 |
| 2019 | 54,480 | 46,650 | 55,281 | 55,090 | 56,839 | 52,377 | 56,501 | 61,399 | 58,968 | 63,984 | 63,661 | 64,961 |
| 2020 | 64,691 | 64,776 | 69,816 | 58,722 | 40,017 | 39,996 | 51,671 | 61,797 | 65,239 | 69,487 | 66,980 | 69,821 |
| 2021 | 66,533 | 56,195 | 66,419 | 66,509 | 68,376 | 66,182 | 62,935 | 67,160 | 68,406 | 70,051 | 69,907 | 70,088 |
| 2022 | 63,936 | 60,054 | 70,296 | 51,307 | 63,261 | 68,899 | 71,976 | 71,282 | 72,480 | 74,451 | 67,433 | 58,318 |
| - = No Data Reported; -- = Not Applicable; NA = Not Available; W = Withheld to avoid disclosure of individual company data. |
| Release Date: 3/29/2024 |
| Next Release Date: 4/30/2024 |