|
Download Data (XLS File) |
|
||||||||
|
||||||||
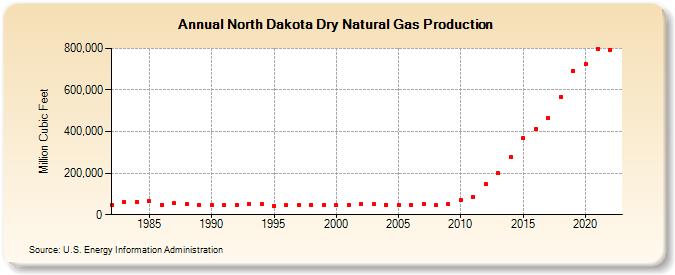
| North Dakota Dry Natural Gas Production (Million Cubic Feet) | ||||||||
| Decade | Year-0 | Year-1 | Year-2 | Year-3 | Year-4 | Year-5 | Year-6 | Year-7 | Year-8 | Year-9 |
|---|---|---|---|---|---|---|---|---|---|---|
| 1980's | 48,216 | 62,148 | 62,636 | 64,213 | 48,142 | 54,399 | 50,802 | 45,041 | ||
| 1990's | 45,725 | 47,137 | 48,828 | 53,927 | 52,134 | 44,141 | 44,737 | 47,325 | 47,704 | 47,058 |
| 2000's | 46,405 | 48,564 | 51,052 | 49,875 | 48,776 | 45,699 | 48,019 | 52,817 | 44,566 | 49,229 |
| 2010's | 70,456 | 82,920 | 146,128 | 198,871 | 275,901 | 369,242 | 412,051 | 464,327 | 566,313 | 690,189 |
| 2020's | 723,012 | 798,762 | 793,694 |
| - = No Data Reported; -- = Not Applicable; NA = Not Available; W = Withheld to avoid disclosure of individual company data. |
| Release Date: 3/29/2024 |
| Next Release Date: 4/30/2024 |