|
Download Data (XLS File) |
|
||||||||
|
||||||||
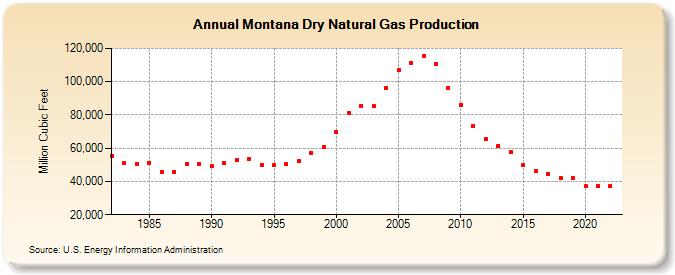
| Montana Dry Natural Gas Production (Million Cubic Feet) | ||||||||
| Decade | Year-0 | Year-1 | Year-2 | Year-3 | Year-4 | Year-5 | Year-6 | Year-7 | Year-8 | Year-9 |
|---|---|---|---|---|---|---|---|---|---|---|
| 1980's | 55,577 | 50,918 | 50,405 | 51,305 | 45,506 | 45,398 | 50,582 | 50,212 | ||
| 1990's | 49,338 | 50,944 | 52,960 | 53,787 | 49,785 | 49,667 | 50,420 | 52,028 | 57,235 | 60,728 |
| 2000's | 69,664 | 80,927 | 85,500 | 85,412 | 96,128 | 106,769 | 111,423 | 115,272 | 110,907 | 96,392 |
| 2010's | 86,172 | 73,372 | 65,463 | 61,597 | 57,490 | 49,626 | 46,374 | 44,760 | 42,096 | 42,074 |
| 2020's | 37,109 | 37,479 | 37,495 |
| - = No Data Reported; -- = Not Applicable; NA = Not Available; W = Withheld to avoid disclosure of individual company data. |
| Release Date: 3/29/2024 |
| Next Release Date: 4/30/2024 |