|
Download Data (XLS File) |
|
||||||||
|
||||||||
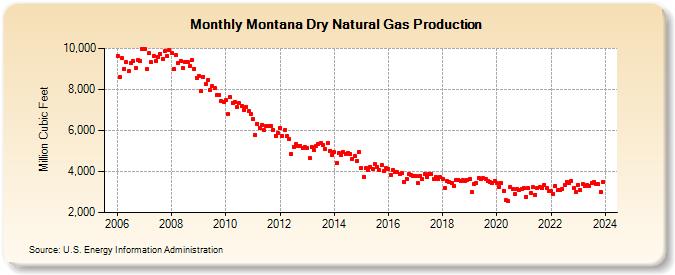
| Montana Dry Natural Gas Production (Million Cubic Feet) | ||||||||
| Year | Jan | Feb | Mar | Apr | May | Jun | Jul | Aug | Sep | Oct | Nov | Dec |
|---|---|---|---|---|---|---|---|---|---|---|---|---|
| 2006 | 9,638 | 8,592 | 9,528 | 9,014 | 9,319 | 8,878 | 9,287 | 9,370 | 9,040 | 9,427 | 9,373 | 9,957 |
| 2007 | 9,955 | 8,979 | 9,752 | 9,324 | 9,619 | 9,399 | 9,580 | 9,745 | 9,506 | 9,861 | 9,638 | 9,914 |
| 2008 | 9,770 | 8,988 | 9,655 | 9,277 | 9,393 | 9,043 | 9,332 | 9,324 | 9,120 | 9,411 | 9,017 | 8,578 |
| 2009 | 8,643 | 7,927 | 8,627 | 8,256 | 8,436 | 7,992 | 8,158 | 8,057 | 7,718 | 7,751 | 7,425 | 7,402 |
| 2010 | 7,480 | 6,781 | 7,629 | 7,355 | 7,386 | 7,125 | 7,316 | 7,202 | 7,003 | 7,143 | 6,926 | 6,826 |
| 2011 | 6,552 | 5,781 | 6,330 | 6,122 | 6,280 | 6,001 | 6,227 | 6,202 | 6,223 | 6,031 | 5,741 | 5,882 |
| 2012 | 6,131 | 5,755 | 6,004 | 5,717 | 5,581 | 4,876 | 5,208 | 5,324 | 5,241 | 5,260 | 5,147 | 5,219 |
| 2013 | 5,138 | 4,645 | 5,178 | 5,033 | 5,245 | 5,331 | 5,395 | 5,305 | 5,092 | 5,386 | 5,021 | 4,828 |
| 2014 | 4,941 | 4,418 | 4,907 | 4,785 | 4,959 | 4,836 | 4,907 | 4,865 | 4,632 | 4,771 | 4,501 | 4,966 |
| 2015 | 4,161 | 3,749 | 4,151 | 4,063 | 4,221 | 4,132 | 4,376 | 4,214 | 4,062 | 4,321 | 4,028 | 4,148 |
| 2016 | 4,134 | 3,834 | 4,081 | 3,954 | 3,955 | 3,861 | 3,914 | 3,488 | 3,645 | 3,864 | 3,851 | 3,794 |
| 2017 | 3,775 | 3,428 | 3,786 | 3,641 | 3,881 | 3,747 | 3,876 | 3,901 | 3,634 | 3,733 | 3,638 | 3,719 |
| 2018 | 3,657 | 3,219 | 3,541 | 3,499 | 3,426 | 3,290 | 3,599 | 3,611 | 3,547 | 3,577 | 3,542 | 3,588 |
| 2019 | 3,654 | 2,986 | 3,387 | 3,434 | 3,695 | 3,639 | 3,660 | 3,613 | 3,552 | 3,489 | 3,433 | 3,531 |
| 2020 | 3,434 | 3,254 | 3,435 | 3,063 | 2,604 | 2,582 | 3,234 | 3,160 | 2,926 | 3,155 | 3,113 | 3,150 |
| 2021 | 3,189 | 2,773 | 3,195 | 2,977 | 3,224 | 2,874 | 3,215 | 3,238 | 3,183 | 3,353 | 3,191 | 3,066 |
| 2022 | 3,019 | 2,887 | 3,269 | 3,076 | 3,068 | 3,108 | 3,264 | 3,439 | 3,389 | 3,454 | 3,164 | 2,357 |
| - = No Data Reported; -- = Not Applicable; NA = Not Available; W = Withheld to avoid disclosure of individual company data. |
| Release Date: 3/29/2024 |
| Next Release Date: 4/30/2024 |