|
Download Data (XLS File) |
|
||||||||
|
||||||||
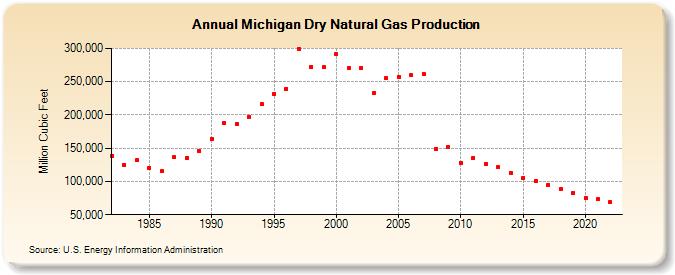
| Michigan Dry Natural Gas Production (Million Cubic Feet) | ||||||||
| Decade | Year-0 | Year-1 | Year-2 | Year-3 | Year-4 | Year-5 | Year-6 | Year-7 | Year-8 | Year-9 |
|---|---|---|---|---|---|---|---|---|---|---|
| 1980's | 138,869 | 125,373 | 131,708 | 120,726 | 115,643 | 136,120 | 135,662 | 146,102 | ||
| 1990's | 163,834 | 187,646 | 186,722 | 197,623 | 216,286 | 231,875 | 239,341 | 299,803 | 272,138 | 271,419 |
| 2000's | 291,234 | 270,534 | 270,246 | 233,149 | 255,482 | 257,404 | 259,732 | 261,813 | 149,209 | 151,402 |
| 2010's | 128,175 | 135,697 | 126,853 | 121,277 | 113,143 | 105,871 | 100,553 | 95,172 | 88,232 | 82,851 |
| 2020's | 75,167 | 73,208 | 68,691 |
| - = No Data Reported; -- = Not Applicable; NA = Not Available; W = Withheld to avoid disclosure of individual company data. |
| Release Date: 3/29/2024 |
| Next Release Date: 4/30/2024 |