|
Download Data (XLS File) |
|
||||||||
|
||||||||
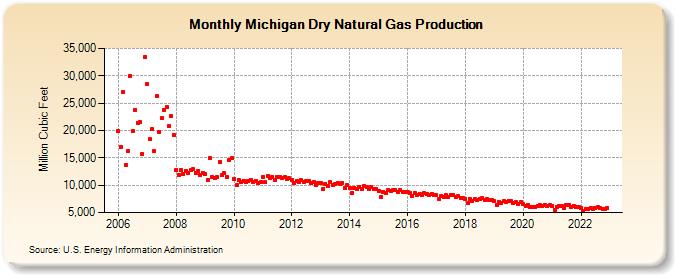
| Michigan Dry Natural Gas Production (Million Cubic Feet) | ||||||||
| Year | Jan | Feb | Mar | Apr | May | Jun | Jul | Aug | Sep | Oct | Nov | Dec |
|---|---|---|---|---|---|---|---|---|---|---|---|---|
| 2006 | 19,883 | 17,063 | 27,033 | 13,724 | 16,250 | 29,932 | 19,947 | 23,815 | 21,426 | 21,485 | 15,743 | 33,432 |
| 2007 | 28,452 | 18,375 | 20,205 | 16,164 | 26,215 | 19,657 | 22,244 | 23,754 | 24,229 | 20,800 | 22,560 | 19,160 |
| 2008 | 12,815 | 11,826 | 12,767 | 12,084 | 12,618 | 12,241 | 12,726 | 12,935 | 12,320 | 12,670 | 11,930 | 12,277 |
| 2009 | 11,969 | 10,885 | 14,918 | 11,443 | 11,360 | 11,504 | 14,266 | 11,778 | 12,143 | 11,495 | 14,682 | 14,960 |
| 2010 | 11,162 | 9,983 | 11,016 | 10,515 | 10,841 | 10,502 | 10,765 | 11,025 | 10,631 | 10,776 | 10,390 | 10,571 |
| 2011 | 11,531 | 10,523 | 11,685 | 11,283 | 11,516 | 11,015 | 11,513 | 11,564 | 11,282 | 11,440 | 11,114 | 11,231 |
| 2012 | 10,998 | 10,311 | 10,794 | 10,608 | 10,885 | 10,501 | 10,715 | 10,709 | 10,313 | 10,556 | 10,119 | 10,341 |
| 2013 | 10,321 | 9,385 | 10,291 | 9,869 | 10,532 | 9,970 | 10,246 | 10,440 | 10,246 | 10,413 | 9,558 | 10,005 |
| 2014 | 9,562 | 8,623 | 9,478 | 9,293 | 9,693 | 9,283 | 9,858 | 9,758 | 9,388 | 9,607 | 9,254 | 9,346 |
| 2015 | 9,017 | 7,871 | 8,755 | 8,640 | 9,118 | 8,914 | 9,091 | 9,140 | 8,751 | 9,057 | 8,801 | 8,716 |
| 2016 | 8,744 | 8,601 | 7,980 | 8,632 | 8,121 | 8,457 | 8,274 | 8,572 | 8,467 | 8,125 | 8,451 | 8,131 |
| 2017 | 8,190 | 7,407 | 8,028 | 7,833 | 8,236 | 7,919 | 8,191 | 8,192 | 7,798 | 8,070 | 7,643 | 7,666 |
| 2018 | 7,529 | 6,782 | 7,460 | 7,175 | 7,477 | 7,321 | 7,514 | 7,610 | 7,277 | 7,517 | 7,236 | 7,333 |
| 2019 | 7,084 | 6,379 | 6,977 | 6,834 | 7,149 | 6,978 | 7,127 | 7,053 | 6,788 | 6,975 | 6,654 | 6,855 |
| 2020 | 6,624 | 6,133 | 6,433 | 6,050 | 6,087 | 5,998 | 6,264 | 6,332 | 6,287 | 6,426 | 6,237 | 6,296 |
| 2021 | 6,207 | 5,499 | 6,094 | 6,109 | 6,239 | 5,924 | 6,374 | 6,386 | 6,032 | 6,249 | 6,026 | 6,069 |
| 2022 | 5,866 | 5,219 | 5,692 | 5,567 | 5,867 | 5,683 | 5,906 | 5,929 | 5,749 | 5,740 | 5,639 | 5,836 |
| - = No Data Reported; -- = Not Applicable; NA = Not Available; W = Withheld to avoid disclosure of individual company data. |
| Release Date: 3/29/2024 |
| Next Release Date: 4/30/2024 |