|
Download Data (XLS File) |
|
||||||||
|
||||||||
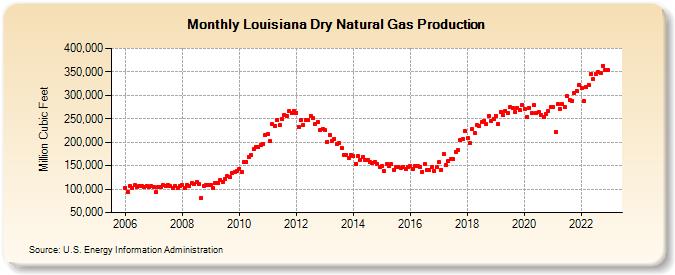
| Louisiana Dry Natural Gas Production (Million Cubic Feet) | ||||||||
| Year | Jan | Feb | Mar | Apr | May | Jun | Jul | Aug | Sep | Oct | Nov | Dec |
|---|---|---|---|---|---|---|---|---|---|---|---|---|
| 2006 | 103,179 | 94,149 | 106,787 | 103,292 | 108,053 | 105,465 | 106,944 | 106,844 | 104,031 | 107,110 | 103,481 | 106,548 |
| 2007 | 104,710 | 93,081 | 105,356 | 103,432 | 108,896 | 105,641 | 109,196 | 105,741 | 103,080 | 106,353 | 102,678 | 106,424 |
| 2008 | 108,824 | 101,639 | 109,423 | 106,887 | 113,001 | 111,049 | 115,083 | 111,736 | 81,165 | 106,694 | 108,950 | 108,733 |
| 2009 | 109,484 | 101,528 | 112,915 | 112,335 | 118,741 | 115,297 | 121,967 | 126,920 | 125,045 | 134,323 | 135,546 | 139,146 |
| 2010 | 143,710 | 137,013 | 157,580 | 158,568 | 168,520 | 172,980 | 185,294 | 189,365 | 189,466 | 193,272 | 196,783 | 215,101 |
| 2011 | 216,641 | 201,616 | 238,263 | 234,597 | 247,480 | 236,033 | 249,680 | 258,648 | 255,200 | 265,884 | 262,581 | 266,953 |
| 2012 | 263,065 | 233,361 | 248,268 | 237,003 | 247,183 | 246,466 | 256,327 | 251,546 | 239,373 | 243,825 | 226,440 | 227,897 |
| 2013 | 225,604 | 201,492 | 215,524 | 203,060 | 207,162 | 196,109 | 197,337 | 188,392 | 173,152 | 171,753 | 166,992 | 173,267 |
| 2014 | 170,576 | 154,119 | 169,732 | 161,348 | 168,383 | 163,105 | 161,260 | 157,484 | 156,603 | 158,356 | 154,235 | 147,967 |
| 2015 | 149,459 | 137,927 | 153,151 | 149,282 | 152,773 | 141,719 | 147,985 | 147,511 | 146,062 | 147,780 | 142,011 | 147,858 |
| 2016 | 149,704 | 142,004 | 149,217 | 150,062 | 147,259 | 136,531 | 152,793 | 140,740 | 141,555 | 147,039 | 138,783 | 146,340 |
| 2017 | 156,991 | 141,002 | 175,809 | 151,367 | 159,021 | 163,749 | 163,267 | 179,952 | 183,488 | 203,915 | 205,989 | 223,249 |
| 2018 | 208,394 | 197,573 | 227,250 | 219,870 | 236,176 | 234,316 | 242,874 | 245,804 | 237,952 | 256,499 | 244,706 | 249,976 |
| 2019 | 256,704 | 239,705 | 264,012 | 257,185 | 267,390 | 262,712 | 274,798 | 273,605 | 263,961 | 272,728 | 267,922 | 279,658 |
| 2020 | 271,489 | 253,787 | 273,848 | 262,402 | 278,528 | 262,055 | 264,241 | 258,110 | 253,640 | 260,734 | 265,510 | 275,777 |
| 2021 | 275,244 | 221,452 | 280,813 | 271,500 | 281,359 | 274,014 | 297,718 | 290,562 | 288,433 | 305,455 | 308,171 | 322,874 |
| 2022 | 316,593 | 288,068 | 317,350 | 322,382 | 346,092 | 333,975 | 346,060 | 349,491 | 346,573 | 363,426 | 354,779 | 353,437 |
| - = No Data Reported; -- = Not Applicable; NA = Not Available; W = Withheld to avoid disclosure of individual company data. |
| Release Date: 8/30/2024 |
| Next Release Date: 9/30/2024 |