|
Download Data (XLS File) |
|
||||||||
|
||||||||
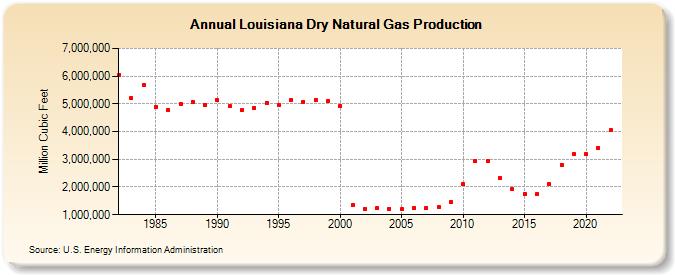
| Louisiana Dry Natural Gas Production (Million Cubic Feet) | ||||||||
| Decade | Year-0 | Year-1 | Year-2 | Year-3 | Year-4 | Year-5 | Year-6 | Year-7 | Year-8 | Year-9 |
|---|---|---|---|---|---|---|---|---|---|---|
| 1980's | 6,042,769 | 5,207,920 | 5,692,554 | 4,895,966 | 4,779,790 | 4,997,619 | 5,060,175 | 4,956,700 | ||
| 1990's | 5,122,584 | 4,905,207 | 4,781,644 | 4,860,802 | 5,041,122 | 4,962,318 | 5,149,901 | 5,079,813 | 5,132,579 | 5,110,936 |
| 2000's | 4,928,223 | 1,349,224 | 1,209,027 | 1,225,444 | 1,219,815 | 1,192,667 | 1,255,883 | 1,254,588 | 1,283,184 | 1,453,248 |
| 2010's | 2,107,651 | 2,933,576 | 2,920,753 | 2,319,844 | 1,923,168 | 1,763,517 | 1,742,027 | 2,107,799 | 2,801,391 | 3,180,380 |
| 2020's | 3,180,120 | 3,417,594 | 4,038,226 |
| - = No Data Reported; -- = Not Applicable; NA = Not Available; W = Withheld to avoid disclosure of individual company data. |
| Release Date: 3/29/2024 |
| Next Release Date: 4/30/2024 |