|
Download Data (XLS File) |
|
||||||||
|
||||||||
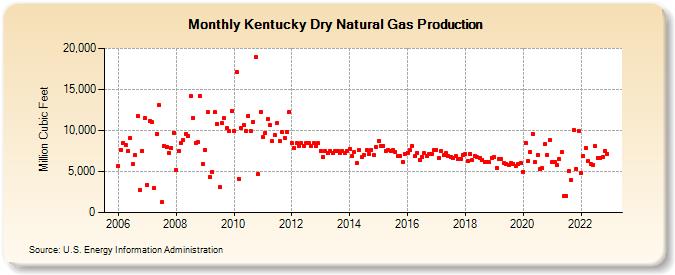
| Kentucky Dry Natural Gas Production (Million Cubic Feet) | ||||||||
| Year | Jan | Feb | Mar | Apr | May | Jun | Jul | Aug | Sep | Oct | Nov | Dec |
|---|---|---|---|---|---|---|---|---|---|---|---|---|
| 2006 | 5,697 | 7,677 | 8,520 | 8,183 | 7,489 | 9,115 | 5,881 | 6,968 | 11,760 | 2,755 | 7,527 | 11,496 |
| 2007 | 3,406 | 11,177 | 11,028 | 2,999 | 9,590 | 13,070 | 1,236 | 8,146 | 7,953 | 7,263 | 7,873 | 9,740 |
| 2008 | 5,222 | 7,491 | 8,501 | 8,780 | 9,590 | 9,270 | 14,157 | 11,552 | 8,504 | 8,568 | 14,157 | 5,923 |
| 2009 | 7,603 | 12,215 | 4,388 | 4,959 | 12,194 | 10,773 | 3,106 | 10,861 | 11,461 | 10,245 | 9,907 | 12,318 |
| 2010 | 9,912 | 17,124 | 4,128 | 10,287 | 10,652 | 9,940 | 11,821 | 9,979 | 11,091 | 18,920 | 4,638 | 12,261 |
| 2011 | 9,162 | 9,704 | 11,350 | 10,611 | 8,658 | 9,444 | 10,917 | 8,759 | 9,774 | 9,096 | 9,790 | 12,294 |
| 2012 | 8,429 | 7,895 | 8,438 | 8,167 | 8,437 | 8,168 | 8,426 | 8,429 | 8,154 | 8,425 | 8,152 | 8,429 |
| 2013 | 7,501 | 6,774 | 7,501 | 7,253 | 7,496 | 7,255 | 7,486 | 7,488 | 7,247 | 7,487 | 7,240 | 7,491 |
| 2014 | 7,723 | 6,879 | 7,335 | 6,029 | 7,595 | 6,768 | 7,006 | 7,575 | 7,149 | 7,607 | 6,955 | 7,998 |
| 2015 | 8,763 | 8,138 | 8,122 | 7,527 | 7,613 | 7,465 | 7,651 | 7,368 | 6,878 | 6,948 | 6,172 | 7,187 |
| 2016 | 7,292 | 7,579 | 8,153 | 6,844 | 7,278 | 6,423 | 6,780 | 7,212 | 6,945 | 7,083 | 7,159 | 7,677 |
| 2017 | 7,682 | 6,657 | 7,448 | 6,997 | 7,230 | 6,862 | 6,818 | 6,659 | 6,857 | 6,492 | 6,569 | 7,054 |
| 2018 | 7,151 | 6,260 | 7,171 | 6,366 | 6,938 | 6,715 | 6,690 | 6,463 | 6,110 | 6,213 | 6,104 | 6,707 |
| 2019 | 6,789 | 5,485 | 6,575 | 6,523 | 6,004 | 5,976 | 5,798 | 6,070 | 5,950 | 5,725 | 5,880 | 6,011 |
| 2020 | 4,982 | 8,473 | 6,224 | 7,399 | 9,604 | 6,147 | 7,017 | 5,250 | 5,379 | 8,302 | 7,072 | 8,807 |
| 2021 | 6,175 | 6,148 | 5,751 | 6,507 | 7,403 | 2,017 | 2,004 | 5,017 | 3,992 | 10,048 | 5,360 | 9,951 |
| 2022 | 4,766 | 6,892 | 7,889 | 6,278 | 5,902 | 5,851 | 8,050 | 6,642 | 6,650 | 6,784 | 7,521 | 7,160 |
| - = No Data Reported; -- = Not Applicable; NA = Not Available; W = Withheld to avoid disclosure of individual company data. |
| Release Date: 3/29/2024 |
| Next Release Date: 4/30/2024 |