|
Download Data (XLS File) |
|
||||||||
|
||||||||
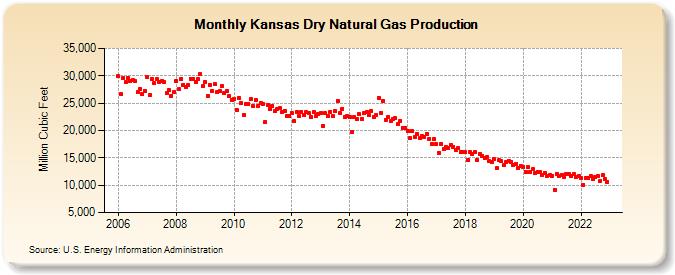
| Kansas Dry Natural Gas Production (Million Cubic Feet) | ||||||||
| Year | Jan | Feb | Mar | Apr | May | Jun | Jul | Aug | Sep | Oct | Nov | Dec |
|---|---|---|---|---|---|---|---|---|---|---|---|---|
| 2006 | 29,881 | 26,619 | 29,613 | 28,810 | 29,602 | 29,084 | 29,222 | 29,033 | 26,997 | 27,603 | 26,611 | 27,244 |
| 2007 | 29,683 | 26,410 | 29,381 | 28,600 | 29,344 | 28,883 | 29,025 | 28,833 | 26,819 | 27,425 | 26,382 | 27,028 |
| 2008 | 29,063 | 27,490 | 29,485 | 28,317 | 27,862 | 28,278 | 29,479 | 29,490 | 28,775 | 29,371 | 30,304 | 28,092 |
| 2009 | 28,859 | 26,305 | 28,387 | 27,223 | 28,433 | 26,975 | 27,149 | 28,170 | 26,932 | 27,198 | 26,261 | 25,597 |
| 2010 | 25,774 | 23,787 | 25,958 | 25,013 | 22,913 | 24,881 | 24,848 | 25,690 | 24,446 | 25,528 | 24,560 | 25,072 |
| 2011 | 24,879 | 21,536 | 24,612 | 24,010 | 24,479 | 23,597 | 23,940 | 24,072 | 23,305 | 23,637 | 22,685 | 22,568 |
| 2012 | 23,208 | 21,694 | 23,368 | 22,557 | 23,456 | 22,858 | 23,357 | 23,240 | 22,455 | 23,340 | 22,602 | 22,946 |
| 2013 | 23,194 | 20,792 | 23,111 | 22,590 | 23,447 | 22,595 | 23,584 | 25,467 | 23,151 | 23,973 | 22,546 | 22,572 |
| 2014 | 22,495 | 19,764 | 22,413 | 22,016 | 22,974 | 22,172 | 23,115 | 23,315 | 22,796 | 23,585 | 22,533 | 22,788 |
| 2015 | 25,905 | 23,257 | 25,350 | 21,964 | 22,530 | 21,727 | 22,154 | 22,209 | 21,263 | 21,787 | 20,498 | 20,482 |
| 2016 | 19,962 | 18,549 | 19,860 | 18,849 | 19,376 | 18,610 | 19,075 | 18,837 | 19,406 | 18,498 | 17,444 | 18,424 |
| 2017 | 17,550 | 15,937 | 17,555 | 16,580 | 16,944 | 16,805 | 17,312 | 17,051 | 16,446 | 16,741 | 16,037 | 16,060 |
| 2018 | 15,979 | 14,572 | 16,044 | 15,610 | 15,982 | 14,581 | 15,661 | 15,307 | 14,924 | 15,192 | 14,416 | 14,283 |
| 2019 | 14,792 | 13,088 | 14,542 | 14,370 | 13,604 | 14,303 | 14,390 | 14,301 | 13,740 | 13,797 | 13,108 | 13,571 |
| 2020 | 13,377 | 12,476 | 13,244 | 12,424 | 12,871 | 12,205 | 12,501 | 12,334 | 11,903 | 12,305 | 11,766 | 11,905 |
| 2021 | 11,747 | 9,178 | 12,086 | 11,694 | 11,900 | 11,580 | 12,047 | 12,044 | 11,618 | 12,017 | 11,526 | 11,684 |
| 2022 | 11,345 | 10,102 | 11,316 | 11,227 | 11,660 | 11,170 | 11,478 | 11,626 | 10,689 | 11,805 | 11,042 | 10,585 |
| - = No Data Reported; -- = Not Applicable; NA = Not Available; W = Withheld to avoid disclosure of individual company data. |
| Release Date: 4/30/2024 |
| Next Release Date: 5/31/2024 |