|
Download Data (XLS File) |
|
||||||||
|
||||||||
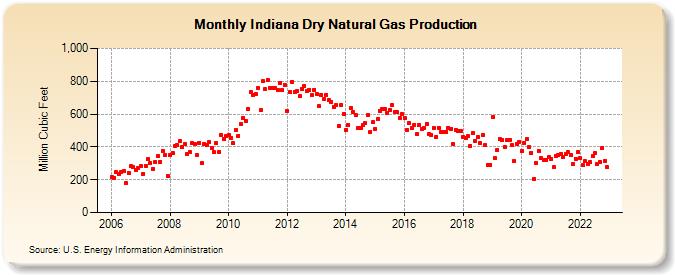
| Indiana Dry Natural Gas Production (Million Cubic Feet) | ||||||||
| Year | Jan | Feb | Mar | Apr | May | Jun | Jul | Aug | Sep | Oct | Nov | Dec |
|---|---|---|---|---|---|---|---|---|---|---|---|---|
| 2006 | 218 | 211 | 246 | 234 | 246 | 254 | 179 | 244 | 282 | 275 | 259 | 272 |
| 2007 | 282 | 235 | 286 | 324 | 301 | 267 | 308 | 343 | 310 | 374 | 351 | 224 |
| 2008 | 349 | 364 | 407 | 409 | 438 | 397 | 416 | 357 | 368 | 423 | 420 | 353 |
| 2009 | 425 | 301 | 419 | 414 | 428 | 393 | 366 | 422 | 370 | 472 | 450 | 468 |
| 2010 | 475 | 457 | 421 | 502 | 468 | 539 | 575 | 556 | 633 | 736 | 717 | 723 |
| 2011 | 761 | 622 | 799 | 751 | 807 | 760 | 758 | 759 | 746 | 788 | 744 | 779 |
| 2012 | 619 | 734 | 797 | 737 | 741 | 707 | 754 | 772 | 742 | 747 | 714 | 749 |
| 2013 | 722 | 647 | 718 | 693 | 719 | 684 | 675 | 643 | 655 | 527 | 657 | 599 |
| 2014 | 505 | 535 | 635 | 611 | 593 | 514 | 514 | 531 | 543 | 594 | 493 | 550 |
| 2015 | 511 | 569 | 620 | 628 | 631 | 608 | 626 | 654 | 614 | 610 | 579 | 599 |
| 2016 | 578 | 503 | 544 | 518 | 535 | 476 | 536 | 509 | 516 | 538 | 479 | 472 |
| 2017 | 516 | 463 | 518 | 491 | 490 | 492 | 518 | 512 | 416 | 505 | 495 | 497 |
| 2018 | 462 | 455 | 464 | 406 | 482 | 435 | 463 | 422 | 472 | 411 | 290 | 291 |
| 2019 | 582 | 331 | 381 | 447 | 442 | 399 | 445 | 442 | 411 | 313 | 420 | 431 |
| 2020 | 378 | 424 | 447 | 400 | 365 | 207 | 300 | 376 | 330 | 318 | 318 | 336 |
| 2021 | 329 | 277 | 344 | 349 | 358 | 339 | 356 | 367 | 352 | 297 | 329 | 367 |
| 2022 | 330 | 292 | 313 | 296 | 306 | 344 | 361 | 296 | 311 | 396 | 316 | 275 |
| - = No Data Reported; -- = Not Applicable; NA = Not Available; W = Withheld to avoid disclosure of individual company data. |
| Release Date: 3/29/2024 |
| Next Release Date: 4/30/2024 |