|
Download Data (XLS File) |
|
||||||||
|
||||||||
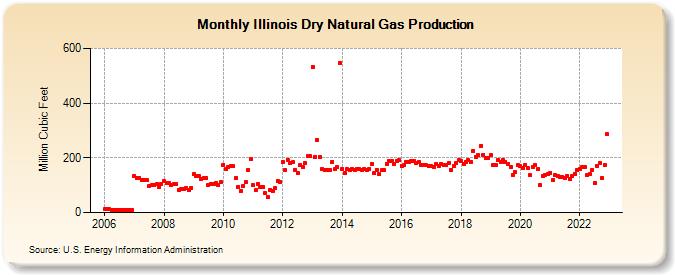
| Illinois Dry Natural Gas Production (Million Cubic Feet) | ||||||||
| Year | Jan | Feb | Mar | Apr | May | Jun | Jul | Aug | Sep | Oct | Nov | Dec |
|---|---|---|---|---|---|---|---|---|---|---|---|---|
| 2006 | 13 | 13 | 12 | 11 | 11 | 11 | 8 | 9 | 9 | 9 | 8 | 9 |
| 2007 | 134 | 128 | 128 | 119 | 120 | 120 | 96 | 99 | 99 | 103 | 95 | 106 |
| 2008 | 114 | 109 | 109 | 101 | 103 | 103 | 82 | 85 | 85 | 88 | 81 | 91 |
| 2009 | 140 | 134 | 134 | 124 | 126 | 126 | 101 | 104 | 104 | 108 | 100 | 111 |
| 2010 | 175 | 161 | 168 | 169 | 169 | 126 | 94 | 79 | 98 | 111 | 157 | 194 |
| 2011 | 99 | 81 | 106 | 95 | 94 | 71 | 56 | 84 | 78 | 88 | 114 | 112 |
| 2012 | 184 | 156 | 193 | 181 | 183 | 156 | 144 | 173 | 165 | 180 | 205 | 205 |
| 2013 | 532 | 203 | 267 | 204 | 160 | 155 | 157 | 155 | 186 | 158 | 165 | 546 |
| 2014 | 160 | 144 | 160 | 155 | 160 | 155 | 160 | 160 | 155 | 160 | 155 | 160 |
| 2015 | 179 | 144 | 157 | 140 | 155 | 155 | 179 | 187 | 188 | 177 | 188 | 191 |
| 2016 | 171 | 172 | 184 | 185 | 188 | 189 | 181 | 184 | 175 | 172 | 172 | 169 |
| 2017 | 170 | 165 | 179 | 171 | 178 | 173 | 175 | 181 | 157 | 169 | 180 | 193 |
| 2018 | 188 | 179 | 186 | 191 | 186 | 226 | 203 | 209 | 245 | 212 | 199 | 201 |
| 2019 | 209 | 173 | 173 | 192 | 186 | 191 | 185 | 178 | 167 | 138 | 148 | 172 |
| 2020 | 170 | 162 | 174 | 162 | 136 | 167 | 172 | 158 | 99 | 134 | 139 | 140 |
| 2021 | 146 | 118 | 137 | 133 | 131 | 130 | 125 | 134 | 124 | 134 | 142 | 156 |
| 2022 | 159 | 166 | 168 | 136 | 140 | 157 | 109 | 171 | 181 | 128 | 175 | 286 |
| - = No Data Reported; -- = Not Applicable; NA = Not Available; W = Withheld to avoid disclosure of individual company data. |
| Release Date: 3/29/2024 |
| Next Release Date: 4/30/2024 |