|
Download Data (XLS File) |
|
||||||||
|
||||||||
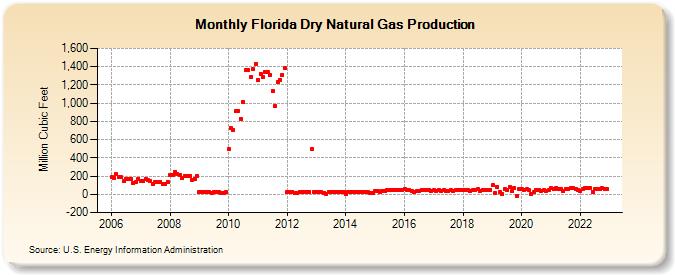
| Florida Dry Natural Gas Production (Million Cubic Feet) | ||||||||
| Year | Jan | Feb | Mar | Apr | May | Jun | Jul | Aug | Sep | Oct | Nov | Dec |
|---|---|---|---|---|---|---|---|---|---|---|---|---|
| 2006 | 185 | 182 | 219 | 195 | 187 | 143 | 168 | 165 | 173 | 129 | 140 | 170 |
| 2007 | 147 | 143 | 171 | 154 | 148 | 117 | 135 | 133 | 138 | 108 | 115 | 137 |
| 2008 | 214 | 207 | 248 | 223 | 217 | 174 | 199 | 196 | 202 | 161 | 171 | 202 |
| 2009 | 23 | 22 | 26 | 24 | 23 | 19 | 21 | 21 | 22 | 17 | 18 | 22 |
| 2010 | 495 | 725 | 704 | 912 | 917 | 829 | 1,010 | 1,360 | 1,359 | 1,290 | 1,376 | 1,432 |
| 2011 | 1,258 | 1,323 | 1,285 | 1,339 | 1,338 | 1,311 | 1,132 | 965 | 1,233 | 1,254 | 1,306 | 1,381 |
| 2012 | 28 | 28 | 29 | 11 | 10 | 27 | 29 | 26 | 27 | 29 | 500 | 28 |
| 2013 | 28 | 27 | 23 | 19 | 5 | 27 | 30 | 21 | 27 | 30 | 28 | 27 |
| 2014 | 6 | 25 | 28 | 30 | 20 | 23 | 26 | 25 | 22 | 22 | 18 | 18 |
| 2015 | 38 | 34 | 30 | 40 | 40 | 46 | 49 | 51 | 51 | 51 | 49 | 49 |
| 2016 | 55 | 45 | 47 | 34 | 21 | 36 | 40 | 46 | 42 | 44 | 46 | 40 |
| 2017 | 42 | 38 | 45 | 41 | 43 | 38 | 39 | 46 | 37 | 42 | 43 | 46 |
| 2018 | 52 | 45 | 52 | 37 | 43 | 52 | 58 | 39 | 50 | 52 | 48 | 48 |
| 2019 | 99 | 16 | 81 | 28 | 4 | 61 | 48 | 78 | 34 | 68 | -14 | 61 |
| 2020 | 59 | 50 | 54 | 42 | 1 | 20 | 46 | 49 | 39 | 44 | 37 | 42 |
| 2021 | 69 | 53 | 67 | 61 | 57 | 39 | 62 | 57 | 66 | 69 | 62 | 49 |
| 2022 | 41 | 61 | 72 | 73 | 70 | 29 | 57 | 59 | 62 | 67 | 60 | 54 |
| - = No Data Reported; -- = Not Applicable; NA = Not Available; W = Withheld to avoid disclosure of individual company data. |
| Release Date: 8/30/2024 |
| Next Release Date: 9/30/2024 |