|
Download Data (XLS File) |
|
||||||||
|
||||||||
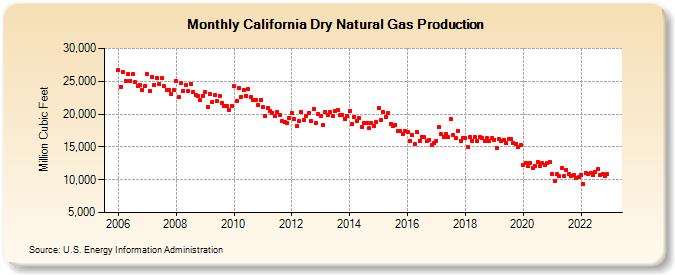
| California Dry Natural Gas Production (Million Cubic Feet) | ||||||||
| Year | Jan | Feb | Mar | Apr | May | Jun | Jul | Aug | Sep | Oct | Nov | Dec |
|---|---|---|---|---|---|---|---|---|---|---|---|---|
| 2006 | 26,709 | 24,159 | 26,358 | 25,054 | 26,148 | 25,090 | 26,049 | 24,843 | 24,309 | 24,405 | 23,739 | 24,290 |
| 2007 | 26,089 | 23,578 | 25,703 | 24,498 | 25,549 | 24,512 | 25,418 | 24,212 | 23,675 | 23,693 | 23,054 | 23,658 |
| 2008 | 25,012 | 22,663 | 24,661 | 23,567 | 24,458 | 23,530 | 24,570 | 23,341 | 22,976 | 22,823 | 22,101 | 22,796 |
| 2009 | 23,307 | 21,069 | 22,988 | 21,884 | 22,871 | 21,921 | 22,770 | 21,669 | 21,242 | 21,219 | 20,627 | 21,287 |
| 2010 | 24,284 | 21,962 | 23,900 | 22,672 | 23,732 | 22,814 | 23,742 | 22,596 | 22,130 | 22,126 | 21,427 | 22,211 |
| 2011 | 21,142 | 19,757 | 20,913 | 20,412 | 20,222 | 19,715 | 20,275 | 19,894 | 18,907 | 18,736 | 18,714 | 19,395 |
| 2012 | 20,148 | 19,226 | 18,237 | 18,869 | 20,346 | 19,112 | 19,685 | 20,222 | 18,926 | 20,758 | 18,582 | 19,958 |
| 2013 | 19,746 | 18,320 | 20,371 | 19,908 | 20,244 | 19,748 | 20,498 | 20,567 | 19,826 | 19,869 | 19,260 | 19,656 |
| 2014 | 20,523 | 18,450 | 19,574 | 18,925 | 19,450 | 18,060 | 18,565 | 18,634 | 17,837 | 18,678 | 18,254 | 18,836 |
| 2015 | 20,863 | 19,069 | 20,240 | 19,557 | 20,138 | 18,546 | 18,166 | 18,405 | 17,361 | 17,475 | 16,981 | 17,376 |
| 2016 | 17,314 | 15,969 | 16,788 | 15,476 | 17,202 | 15,928 | 16,557 | 16,437 | 15,871 | 16,009 | 15,333 | 15,545 |
| 2017 | 15,932 | 18,074 | 16,902 | 16,516 | 17,009 | 16,460 | 19,184 | 16,755 | 16,355 | 17,485 | 15,937 | 16,383 |
| 2018 | 16,358 | 14,958 | 16,437 | 15,861 | 16,461 | 15,953 | 16,434 | 16,366 | 15,897 | 16,345 | 15,872 | 16,278 |
| 2019 | 16,087 | 14,865 | 16,201 | 15,847 | 16,024 | 15,545 | 16,154 | 16,215 | 15,530 | 15,465 | 14,908 | 15,249 |
| 2020 | 12,265 | 12,622 | 12,082 | 12,518 | 11,811 | 12,124 | 12,720 | 12,161 | 12,484 | 12,193 | 12,493 | 12,668 |
| 2021 | 10,846 | 9,833 | 10,807 | 10,509 | 11,710 | 10,600 | 11,506 | 10,875 | 10,582 | 10,646 | 10,287 | 10,366 |
| 2022 | 10,780 | 9,303 | 11,028 | 10,822 | 11,009 | 10,730 | 11,142 | 11,582 | 10,676 | 10,917 | 10,512 | 10,805 |
| - = No Data Reported; -- = Not Applicable; NA = Not Available; W = Withheld to avoid disclosure of individual company data. |
| Release Date: 3/29/2024 |
| Next Release Date: 4/30/2024 |